 PledgeBox
Campaign Data Analytics for Crowdfunding Creators
Learn how campaign data analytics helps Kickstarter and Indiegogo creators measure, interpret, and optimize every phase of a crowdfunding launch.

Learn how campaign data analytics helps Kickstarter and Indiegogo creators measure, interpret, and optimize every phase of a crowdfunding launch.
You're in week two. Traffic is up, pledges are flat, one ad looks profitable and your best referral source shows no conversions at all. You don't lack numbers, you lack a way to decide what to do next. Campaign data analytics is that decision system, and it works best when you treat pre-launch, live, and post-campaign data as one story about a backer, not three separate reports.
A first-time creator in week two often stares at three tabs telling three different stories. Kickstarter shows a traffic spike, an ad platform claims cheap clicks, and the email tool reports strong opens, yet pledges barely move. The problem isn't effort. It's that each number is being read alone, without asking what decision it should change today.
That problem has a long history. From the 1960s through 2004, campaigns commonly bought television aimed at broad demographics rather than modeling individuals, a shift traced in the history of campaign analytics from mass to addressable targeting. Large-scale digital targeting became prominent in 2008, and by 2012, described as the "big data election" in that same history, teams combined voter files, geography, polling, and behavior to choose messages and timing.
The workflow that emerged still fits crowdfunding. Collect audience data, segment people, test message variations, measure responses, and move resources toward what works. Your campaign page, pre-launch list, and survey are your version of that loop.
The scale of testing changed fast, too. Paid online advertising by both major parties reportedly rose from $22.25 million in 2008 to approximately $1.1 billion in a subsequent cycle, a nearly 5,000% increase documented in research on the growth of digital campaign experimentation. You don't need that budget to borrow the lesson, which is to test, measure, and reallocate while the campaign is live.
Creators who publish podcasts or videos to build an audience face a similar trap, and Podmuse podcast analytics insights are useful context for separating listening signals from vanity totals. The principle transfers directly. A spike only matters if you can connect it to signups, pledges, or later purchases.
A useful test: If a metric dropped tomorrow, would you know exactly what you would change? If not, you're reporting, not analyzing.
That mindset carries through fulfillment. A project that barely funds but learns which backers upgrade, complete surveys, and return can build a community. A project that funds and learns nothing starts from zero next time.
For a Kickstarter or Indiegogo creator, campaign data analytics isn't generic web analytics with a funding goal attached. Web analytics asks how a page performed. Creator analytics asks how a relationship is progressing, from first signup to pledge, survey, delivery, and a possible second pledge on your next launch.
The map below shows the five areas that relationship covers.
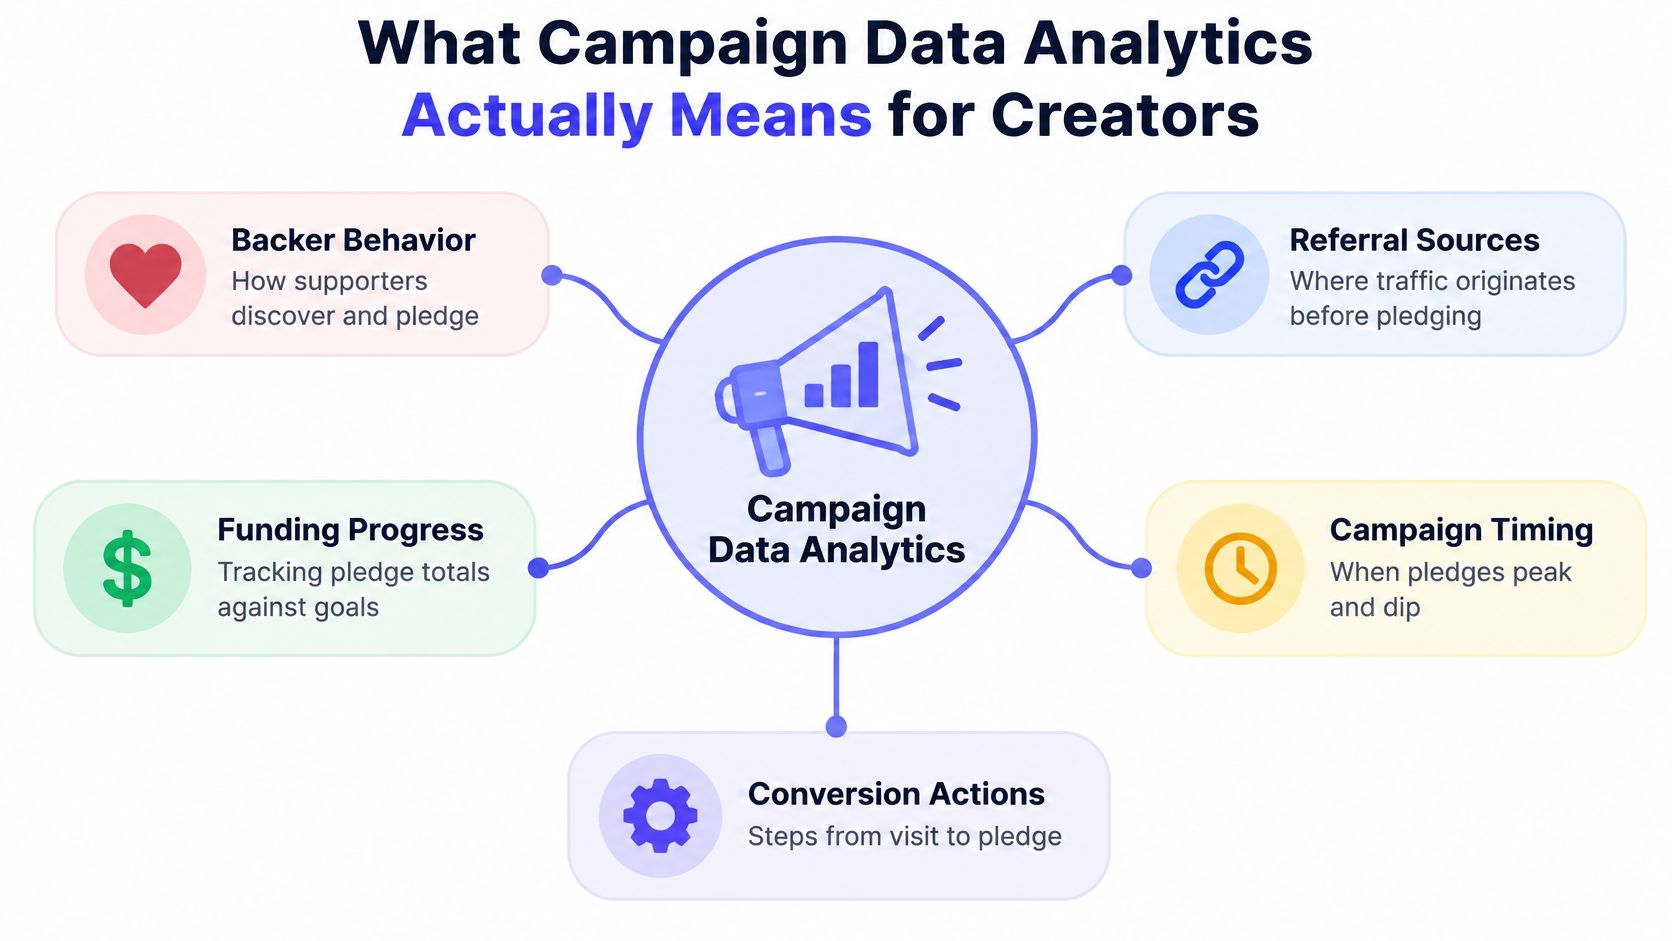
Keep these questions taped above your desk. Each one points to a different decision.
Most dashboards answer the first two well and ignore the rest. That's why creators can hit a goal and still lose money. Profitability lives in questions three through five.
Descriptive metrics tell you what happened, such as total pledges yesterday. Diagnostic metrics help explain why, such as a conversion drop after traffic shifted to mobile. Predictive metrics estimate what's next, such as which segment is likely to complete a survey late based on past behavior.
Confusion starts when a descriptive number is treated as a diagnosis. A falling daily total in the mid-campaign dip doesn't automatically mean your page broke. You need source, device, and tier breakdowns before you rewrite anything.
First-party data is the foundation here. That's consented data you collect yourself, including pre-launch signups, email engagement, pledges, and survey answers. Platform reports are useful, but they're incomplete and defined by the platform. Your own records let you follow the same person across phases.
You don't need dozens of metrics. You need a small set grouped by the job each one does. A practical KPI tracking guide for local businesses makes the same general point for a different audience, which is that a KPI should be tied to a goal and reviewed on a cadence, not collected because a tool offers it.
| Group | Metric | What It Measures | Decision It Triggers |
|---|---|---|---|
| Acquisition | Referral source share | Where visitors and pledges originate | Shift effort toward sources that convert, not just click |
| Acquisition | Cost per lead | Spend divided by new email signups | Pause or rewrite ads that buy cheap, unresponsive leads |
| Conversion | Page conversion rate | Pledges divided by page visits | Fix page clarity, pricing, or traffic fit |
| Conversion | Average pledge | Total pledged divided by backers | Adjust tier ladder and add-on placement |
| Conversion | Funding velocity | Pledges or funds gained per day | Time updates, outreach, and stretch goals |
| Backer quality | Survey completion rate | Completed surveys divided by backers | Send reminders and simplify confusing questions |
| Backer quality | Add-on uptake | Backers adding extras in the survey | Reorder offers and improve product photos |
| Backer quality | Refund and failed payment rate | Lost pledges after commitment | Improve payment recovery and expectation setting |
Acquisition without conversion misleads you. A creator interview can send a wave of curious visitors who never pledge, while a small forum thread sends fewer people who pledge at a high rate. Judge sources by pledged value and downstream behavior, not visits alone.
Conversion without backer quality also misleads you. A discount tier can lift average conversion while attracting backers who ignore surveys, dispute shipping, and never buy add-ons. That's revenue with a support bill attached.
Page views, follower counts, and impressions photograph well for updates. They rarely tell you whether to spend, pause, rewrite, or remind.
Vanity metrics aren't useless for morale, but don't optimize for them. If a number can't trigger a spend, message, pricing, or operations decision, demote it to a weekly glance. Your daily attention belongs to conversion, tier mix, and the quality signals that predict fulfillment cost.
The same metric means different things at different times. A strong email click rate before launch predicts launch-day pledges. The same click rate after funding may predict survey completion. Separating phases keeps you from applying the wrong fix.
The progression below shows how your focus should shift as the campaign moves.
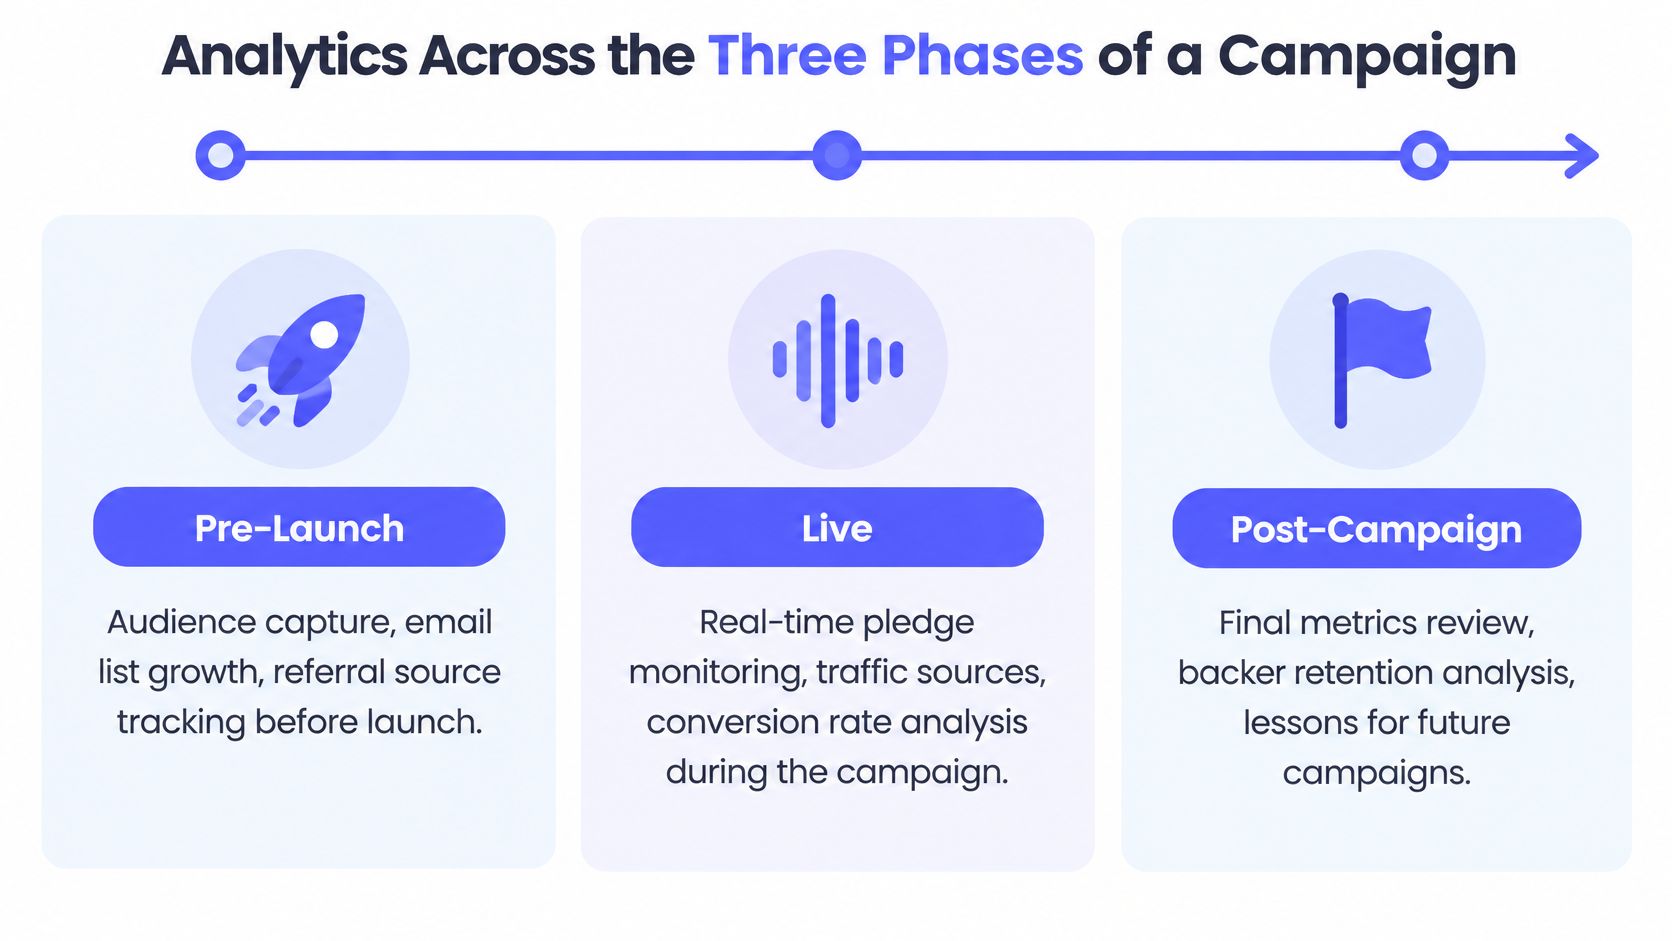
Most creators overinvest in the middle column. It's the most visible, so it feels most important. But pre-launch determines how expensive live pledges are, and post-campaign determines whether those pledges become profit.
Consider two identical funding totals. One creator collected accurate addresses early, sold relevant add-ons, and recovered failed payments quickly. The other chased incomplete surveys for months and absorbed reshipping costs. Their live dashboards matched. Their bank accounts didn't.
Treat the survey period as a second campaign with its own conversion rate, revenue per backer, and dropout points, not as paperwork after the real work ends.
Build one simple sheet with three tabs, one per phase, and carry a backer's source and tier through all three. That single habit connects an ad clicked in month one to margin in month six.
The hardest question sounds simple. What caused this pledge? A backer might discover you through a creator video, search your name a week later, join your list, and pledge after a launch email. Last-click attribution credits only the email and makes the video look worthless.
This diagram separates credit assignment from true added value.
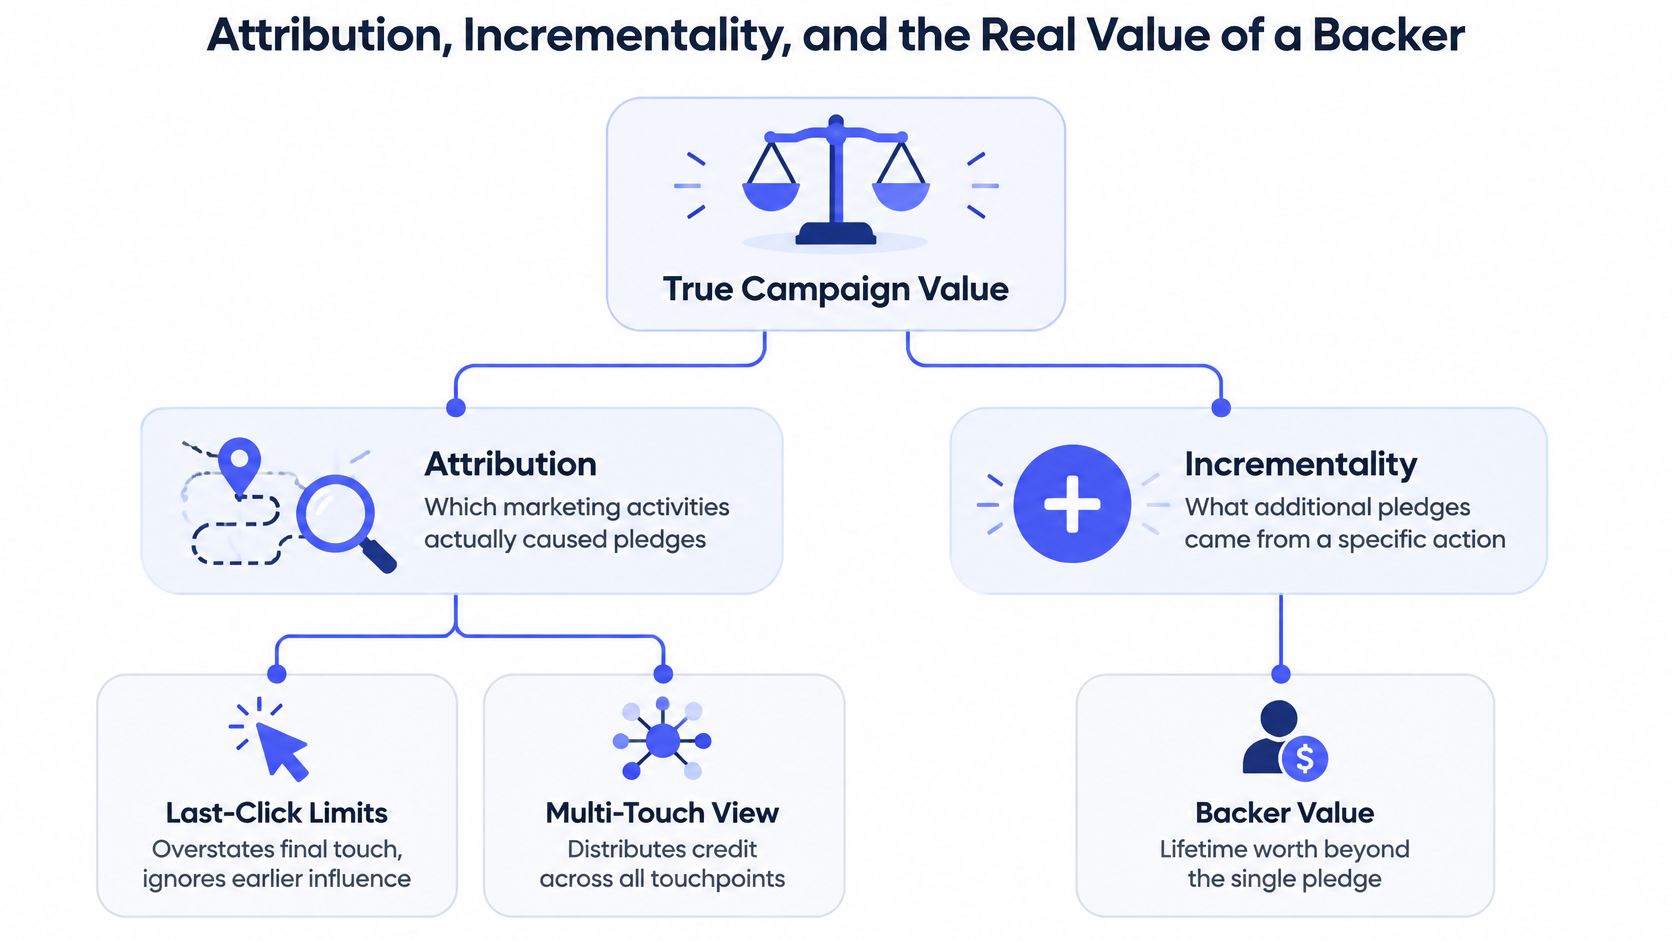
Privacy changes make this harder, not easier. The discontinuation of third-party cookies and stronger privacy standards have made user-level attribution harder, a limitation examined in comparative research on attribution and marketing-mix approaches. That research context supports a humbler approach. Report ranges and assisted conversions instead of one precise return figure you can't defend.
If you want the mechanics of different credit models before you choose one, this attribution modeling guide is a helpful primer. Pair it with your own traffic source analysis for crowdfunding campaigns so model choice stays tied to how backers arrive.
The video below walks through related measurement ideas you can adapt to a creator budget.
Kickstarter had surpassed 651,000 launched projects by January 2025, with a historical success rate of 41.98% and cumulative pledged volume exceeding $8.5 billion, according to Statista data on Kickstarter projects and pledged dollars. In a mature market that size, the first pledge is an incomplete endpoint.
Group backers into cohorts by source, tier, geography, and phase. Then compare add-on revenue, survey completion, fulfillment cost, refunds, support contacts, and repeat backing. A channel with weaker launch return can win if its backers upgrade, complete surveys promptly, and return for your next project. Measure contribution margin per backer, not just funds raised.
Benchmarks are useful as a sanity check and dangerous as a target. A board game with expansion add-ons, a hardware gadget with certification costs, and a book with simple shipping will not share healthy averages for pledge size, survey behavior, or support load. Comparing across those categories creates panic where patience was needed.
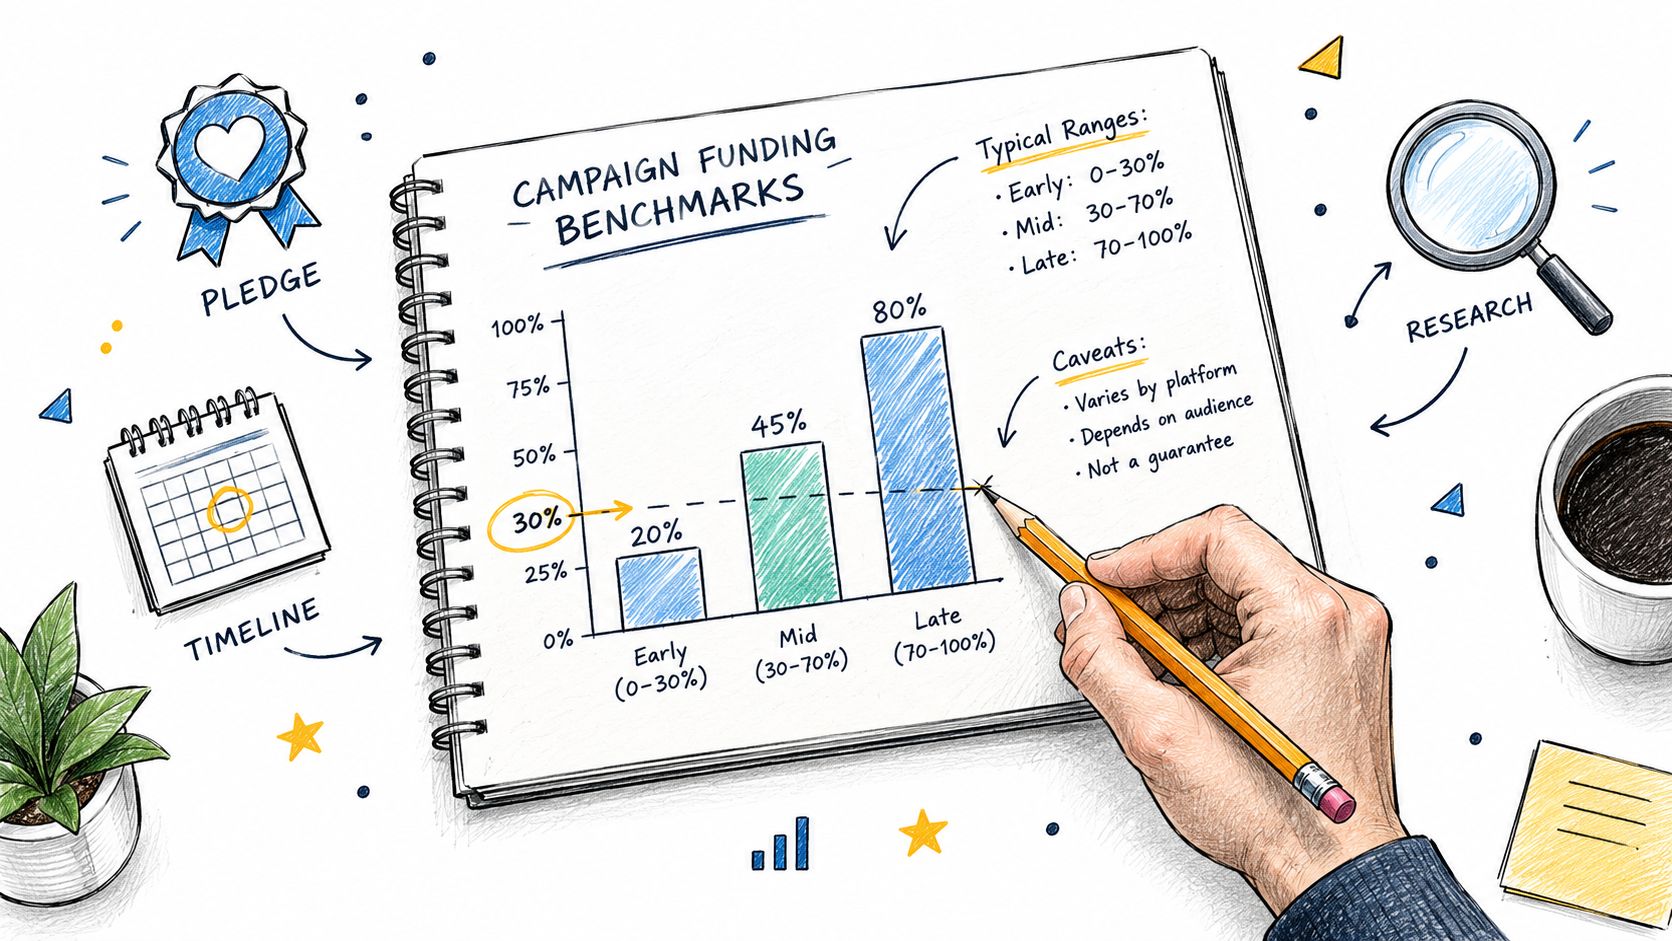
Your own past data, even from a small first campaign, beats borrowed averages. That's why keeping clean records matters, and a structured historical data analysis approach for creators helps you turn last campaign's exports into this campaign's baselines.
Response rule: Act when a metric breaks from your own trend, your segment pattern, or your economic threshold. Wait when it merely sits below someone else's published average.
Set thresholds before launch, while you're calm. Decide what conversion drop triggers a page edit, what lead cost triggers a pause, and what survey completion level triggers extra reminders. Mid-campaign you will be tired, and tired creators either chase every wiggle or freeze. Pre-set thresholds prevent both.
After funding, analytics often fragment. Pledges sit in one export, addresses in another, shipping payments in a third, and support emails hold the context that explains the gaps. Centralizing the pledge manager is therefore an analytics decision, not just an operations choice.
A useful analogy is marketplace versus store. Kickstarter's pledge manager is like Amazon, a marketplace environment where the platform's usual economics apply inside its system. PledgeBox's pledge manager is like Shopify, a store you configure for your post-campaign offers, branding, and data flow.
PledgeBox is free to send the backer survey, with no setup fee, campaign fee, per-backer fee, or fee on original Kickstarter or Indiegogo funds, and it charges 3% only on revenue collected through the survey as stated in PledgeBox pricing details. If the survey collects no additional revenue, you pay nothing for sending it.
Kickstarter's standard economics include a 5% platform fee, with payment processing generally adding approximately 3% to 5%, and shipping and add-on funds collected in its pledge manager are subject to the same fees while taxes there are not, as explained in the pledge manager revenue reporting comparison. That difference changes contribution margin per backer, so it belongs in your model before you price add-ons.
In PledgeBox, survey completion, shipping and tax collection, add-on revenue, address validation signals, and late pre-order conversion can be reviewed together and exported for your own dashboard, building on the reporting functionality available to creators. You can connect a backer's original tier to what they added, what shipping they paid, and whether their address needed correction.
That connection removes manual reconciliation, which is where post-campaign analytics usually die. Instead of matching spreadsheets by email address at midnight, you spend that time on the cohorts that didn't complete, the add-ons nobody understood, and the regions where shipping cost eroded margin.
Start small and keep the same definitions all the way through. One consistent sheet or dashboard you open beats a complex stack you abandon in week two.
Campaign data analytics isn't a launch dashboard. It's a backer-lifecycle lens. The ad, email, pledge, survey, and delivery are chapters in one relationship, and each chapter produces data that should make the next chapter cheaper or more profitable.
You won't get perfect attribution, and you don't need it. You need clean first-party records, honest ranges, a few controlled tests, and the discipline to judge backers by lifetime margin. Creators who do that stop asking why today's number moved and start knowing what to do before tomorrow's arrives.
Connect your pre-launch, live, and post-campaign data in one place so survey completion, add-ons, shipping, and late pre-orders feed the same backer view you used to launch. PledgeBox lets you send your backer survey for free and only charges 3% on upsell revenue collected through it, so you can start centralizing your analytics without upfront cost.
PledgeBox
The All-in-One Toolkit to Launch, Manage & Scale Your Kickstarter / Indiegogo Campaign