Boost Your Campaign with Historical Data Analysis
Learn how historical data analysis can predict campaign success and boost pledge revenue. A practical guide for Kickstarter and Indiegogo creators.
Learn how historical data analysis can predict campaign success and boost pledge revenue. A practical guide for Kickstarter and Indiegogo creators.
You finished a campaign. Funding came in, surveys went out, rewards shipped, and everyone on the team moved on to the next fire. Then the planning for campaign two starts, and the same questions show up again.
Why did one reward tier move fast while another stalled? Which launch-day emails brought in actual backers instead of clicks? Did your add-ons work because they were good, or because the most engaged backers would have bought almost anything? Most creators answer those questions from memory. That's where mistakes start.
A completed campaign leaves behind something more useful than a celebration post. It leaves a record of behavior. If you treat that record seriously, historical data analysis stops being abstract and becomes one of the few reliable ways to improve your next launch.
Creators usually think their campaign history lives in a few top-line stats. Total raised. Number of backers. Maybe a screenshot of the launch-day spike. That's not enough to guide the next campaign.
The useful part is the pattern underneath. Your last campaign can tell you when momentum accelerated, which reward tiers attracted the right buyers, where confusion appeared, and what people still wanted after the campaign ended.

A creator will often say, “Our premium tier didn't work,” when the actual story is narrower:
That's why historical data analysis matters. It helps separate surface outcomes from operational causes.
Practical rule: Never analyze a past campaign at the campaign level only. Analyze it by time, by backer segment, and by what people bought after the pledge.
A good post-campaign review doesn't give you a perfect prediction. It gives you better decisions.
You stop guessing whether to repeat a reward structure. You stop copying your own old launch calendar without checking whether the environment has changed. You stop treating all backers as if they behaved the same way. That's the shift that improves campaign planning. Not luck, not vague “lessons learned,” but structured review of what already happened.
Historical data analysis in crowdfunding means using records from previous campaigns to make better choices in the next one. The easiest analogy is game film. A strong sports team doesn't only look at the final score. It studies possessions, timing, mistakes, and what worked under pressure.
Creators should do the same thing. Your Kickstarter or Indiegogo dashboard is just the scoreboard. Actual value comes from reviewing the full playbook behind it.

Organizations often possess more usable data than they realize. The trick is pulling it into one decision process.
Here are the main sources:
That last category is usually underused, even though it's often the clearest signal of buyer intent.
Using old records to guide future decisions is ancient. A modern summary highlighted census use in the Han dynasty in China during the 2nd century, including a recorded population of 59.6 million, and noted earlier population recordkeeping in ancient Sumer and Babylonia for food allocation. The point is practical, not academic. Historical data analysis started as a way to manage resources and plan better, which is exactly what creators are doing when they review past campaign behavior before a relaunch or new launch (UiPath's summary of data analysis history).
That same logic applies to crowdfunding. Your campaign records are resource-planning records. They tell you where demand concentrated, where shipping complexity increased, and where buyers accepted or rejected value.
A proper review should answer questions like these:
| Question | Historical signal to review |
|---|---|
| Which reward tiers attracted committed backers? | Tier selection, upgrades, and add-on attachment |
| When did momentum fade? | Daily or hourly pledge trends |
| Which traffic sources brought the right people? | Referral paths plus pledge quality |
| What did backers want after funding ended? | Survey selections, add-ons, address issues, shipping choices |
For a broader strategic lens, The Business Model Analyst's crowdsourcing view is useful because it frames crowdfunding as more than fundraising. It's also market validation, demand discovery, and community participation.
If you want to see how campaign data can reveal practical patterns inside a specific category, this piece on gaming industry crowdfunding insights from data mining is a strong example of how operators can turn campaign history into planning input.
Most creators don't need advanced statistical training. They need a working set of methods that answer real campaign questions. The key is not picking one chart and trusting it blindly.
A solid review combines methods because each one answers a different question. Trend analysis, regression, time-series decomposition, anomaly detection, and confidence intervals work together to cross-check patterns and avoid overreading a single metric, as outlined in Office Timeline's overview of historical data analysis methods.

Time-series analysis looks at how pledges, traffic, or upgrades changed over time.
For crowdfunding, this is how you find your campaign rhythm. You can see when launch-day energy peaked, when the middle slowed down, and whether late urgency really moved buyers or just shifted existing demand forward.
Use it to answer:
This method is especially useful when your campaign “felt” strong but had uneven performance. Feelings blur. Time stamps don't.
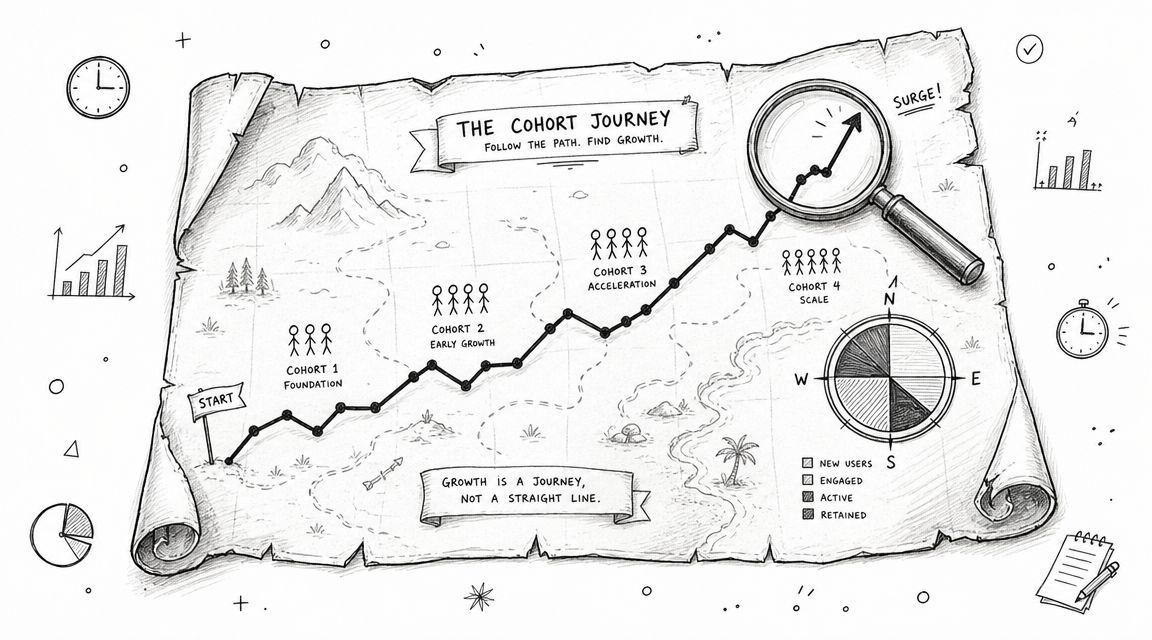
Not all backers behave the same way. Cohort analysis groups them by a shared trait so you can compare behavior.
Useful cohort cuts include:
Creators often discover that the “average backer” doesn't really exist. Some groups buy add-ons. Some groups create support load. Some groups pledge early but need more reminders after the campaign.
Regression sounds technical, but the practical question is simple. Which factors moved with funding or order value, and which ones didn't?
You might compare:
Regression doesn't magically prove causation. It helps you test whether a relationship is worth taking seriously. That matters when teams over-credit a single tactic because it happened near a spike.
If you need a straightforward way to think about channel efficiency before doing heavier analysis, Gorilla's marketing ROI guide gives a practical framework for comparing what you spent with what each effort returned.
A good analysis doesn't ask, “What happened?” once. It asks, “What happened over time, for whom, and under what conditions?”
If you've run more than one project, compare campaign to campaign. Not just totals. Compare structure.
Look at changes in:
A campaign metrics reference like this guide to evaluating crowdfunding performance can help you build the right scorecard before you start comparing apples to oranges.
You finish fulfillment planning, export the files, and spot three uncomfortable facts. The reward tier that looked popular created support headaches. A small group of backers drove a large share of add-on revenue after the campaign ended. Shipping exceptions clustered around only a few products. That is the point where historical analysis becomes useful. It stops being a report and starts shaping the next launch.
Historical data analysis only works if exported files and platform reports turn into decisions. The process does not need advanced tooling. It needs a repeatable review that connects campaign behavior, post-campaign behavior, and fulfillment friction.
Start with one campaign folder and pull in every relevant export. Include platform data, ad reports, email logs, site analytics, survey responses, shipping selections, support tags, refund notes, and team comments from the campaign period. Kickstarter or Indiegogo shows you the front half of the story. Your pledge manager and support records usually explain what happened after the pledge, which is where many of the best planning signals live.

Clean the data before you compare anything. If reward names change between campaign tiers, add-ons, and fulfillment SKUs, your analysis breaks fast. If dates use different formats across email, ads, and surveys, you will line up the wrong events and draw the wrong conclusion.
For crowdfunding, that usually means:
Dirty inputs create clean-looking charts with bad logic behind them.
Many creators often overlook the most valuable data. Campaign pledges show intent at the moment of excitement. Post-campaign survey and pledge manager data shows what backers chose after they had time to review options, compare shipping costs, and decide whether add-ons were worth it.
That second layer matters because it answers practical questions the campaign dashboard cannot answer well. Which backers upgraded once shipping was visible? Which products caused address corrections or support tickets? Which bundle combinations produced higher average order value without creating fulfillment problems?
One option creators use here is PledgeBox. It is free to send the backer survey and only charges a share of upsell revenue if upsells happen. That model makes sense for teams that want post-campaign data without paying survey software costs before revenue shows up. If you are building this workflow, the guide to structuring a backer survey is a useful reference for deciding what to collect.
Start with decisions you need to make for the next campaign.
A useful review list looks like this:
These questions produce better campaign plans because they connect revenue to operations. A tier that raises funding but creates returns, exceptions, or slow survey completion may not deserve a repeat.
Field note: Fulfillment friction is often the most useful dataset in the whole review. Address changes, split shipments, SKU confusion, and exception cases usually point to offers that looked good on launch day but caused expensive problems later.
Past results are a reference point, not a script. A pattern from your last campaign still needs a current-market check. If freight costs changed, your category got more crowded, or your audience shifted toward lower-priced rewards, the old playbook may need adjustment.
The FAIR Institute makes a similar point in its piece on using historical data with evolving conditions. Historical patterns stay useful only when the surrounding conditions are still close enough to matter.
Ask direct questions:
Here's a quick walkthrough of the kind of post-campaign review process creators often use before relaunching:
Use historical analysis to test what deserves to carry forward. Keep the patterns that still hold under current conditions, and treat the rest as background, not marching orders.
A creator finishes a campaign, sees the funding total, and assumes the story is clear. It usually is not. The useful story shows up later, in pledge manager orders, add-on attachment rates, upgrade patterns, support tickets, and late-backer behavior.
That is why the strongest examples usually start after the campaign closes.
A board game team came into a second Kickstarter with a common problem. The first campaign funded well, but the add-on mix was messy. A few expansions sold out expectations. Others looked good on the campaign page and then underperformed once backers reached the survey.
The turning point came when the team stopped reviewing only campaign totals and pulled post-campaign order data from its pledge manager. In PledgeBox, they could sort backers by entry timing, original reward tier, and what each group added after the campaign. That split exposed a pattern the Kickstarter dashboard had hidden. Early backers were not only quicker to pledge. They were also more likely to add premium extras once they had time to review the full catalog.
That changed the next launch plan in practical ways. The team built a stronger first-day bundle, simplified the expansion lineup, and held one higher-margin add-on for the buyers who historically upgraded in the survey. They also cut a weak add-on that had created packing complexity without enough post-campaign demand to justify it.
The result was a cleaner offer structure and fewer fulfillment headaches.
An Indiegogo gadget team had a different issue. Their first campaign followed the usual arc. Strong opening. Quiet middle. Rush at the end. They knew the middle of the campaign lost energy, but "post more updates" was not a real plan.
So they reconstructed the flat period from the first campaign. They lined up traffic spikes, update timing, referral sources, and pledge changes by day. Then they added post-campaign behavior to the review. Buyers who entered during the middle stretch were less likely to upgrade later and more likely to choose the base product only. That mattered. It suggested the middle of the campaign was attracting attention, but not enough conviction.
With that pattern in hand, the team changed timing instead of changing everything. They scheduled a product reveal for the middle of the second campaign, paired it with a clearer use-case update, and tied it to an add-on that had converted well in the first campaign's survey. That choice came from their own history, not from a generic rule about stretch goals or launch theater.
I have seen this kind of adjustment work better than broad campaign rewrites. A single timing change, backed by clean historical review, usually produces more than a dozen small guesses.
Historical analysis earns its keep when it changes one operating decision. Tier design, reveal timing, add-on structure, shipping setup, or survey flow.
Both examples point to the same working rule. Campaign-page metrics show what happened in public. Pledge manager data shows what buyers wanted once the rush settled down. For a creator planning the next Kickstarter or Indiegogo launch, that second dataset is often the one worth trusting most.
The teams that benefit from historical data analysis don't treat it as a one-time audit. They build a loop.
Collect the data. Analyze what happened. Form a hypothesis. Test the next version. Then repeat after the next campaign. That cycle is what turns campaign history into operating knowledge.
Use this four-part process:
That last point matters. Most creators already have enough information to improve. They just spread attention across too many fixes at once.
If you're doing your first serious review, start here:
| Question | Why it matters |
|---|---|
| Which reward tier created the strongest buyers? | Helps you redesign the offer stack |
| When did the campaign lose momentum? | Helps you place updates and reveals |
| Which channel brought the most committed backers? | Helps you allocate launch effort |
| Which add-ons or survey choices signaled deeper demand? | Helps you build the next product mix |
A tight review beats a broad one. Pick the questions tied to your next decision. Ignore the rest until later.
What works is structured review tied to actions. What doesn't work is collecting exports, scanning a few graphs, and declaring that your audience “likes premium” or “doesn't respond in week two.”
Good analysis stays close to operations. It looks at who bought, when they bought, what they changed afterward, and whether today's market still resembles the one that produced the old data.
If you do that consistently, every completed campaign becomes more than revenue. It becomes training data for the next launch.
If you want a simpler way to collect structured post-campaign data, send surveys, capture add-on behavior, and keep future campaign analysis cleaner, take a look at PledgeBox.
The All-in-One Toolkit to Launch, Manage & Scale Your Kickstarter / Indiegogo Campaign