Traffic Source Analysis for Crowdfunding Creators
Learn traffic source analysis for crowdfunding campaigns. Track UTMs, pixels, CPA, and LTV to optimize Kickstarter and Indiegogo funnels end to end.


Learn traffic source analysis for crowdfunding campaigns. Track UTMs, pixels, CPA, and LTV to optimize Kickstarter and Indiegogo funnels end to end.
You can feel the campaign moving, but the numbers still don't make sense. One day a Discord post sends a burst of clicks, another day an influencer mention barely moves pledges, and your ad account keeps spending while you wonder which traffic source is worth the money.
That's exactly where traffic source analysis earns its keep. For crowdfunding, it's not a vanity report. It's the difference between guessing at momentum and knowing which channels are creating backers, which ones are creating noise, and which ones are feeding the late-pledge window after launch day.
Crowdfunding traffic rarely behaves like neat ecommerce traffic. A creator can get visits from ads, newsletter swaps, creator communities, podcast mentions, and direct visits, then see pledges arrive in a pattern that feels random. The reason is simple, channel-level performance matters more than raw traffic, because traffic-source analysis is built around categorizing visitors into channels such as organic search, paid search, social media, email, direct, and referral, then measuring each channel's volume, conversion rate, and customer lifetime value. Those benchmark mixes vary by business type, and the useful part is not the exact mix, it's the reminder that a channel can look small and still be valuable if it converts and retains well. Count's traffic source analysis reference frames this as a budget and attribution tool, not just a visit counter.

A launch page can get healthy attention and still miss the funding goal if the traffic is low intent, mis-targeted, or arriving from channels that never come back. In Google Analytics-style reporting, the key question is acquisition segmentation, sessions and conversions by source or medium, not just the number of visits. A widely used guide also notes the shift in GA4 toward session source, session medium, session source/medium, session campaign, and session default channel grouping, which turns a simple referrer list into a structured attribution view. Databox's GA traffic sources guide captures that shift well.
That matters on Kickstarter and Indiegogo because one visit can become a high-value pledge, a late pledge, or an upsell later in the pledge manager. If you only watch total visits, you can keep funding a dead ad set because the dashboard still looks busy. If you track sources properly, you can catch the channels that are still converting, and stop pouring money into the ones that are just collecting clicks.
Practical rule: if a channel is bringing traffic but not producing pledges, treat it as a hypothesis, not a win.
The creator who tracks sources sees the drop early. The creator who doesn't usually discovers the problem after the budget is gone and the campaign is already off pace.
Most attribution problems start before launch. Someone publishes ads with inconsistent UTM tags, a freelancer invents a new naming style mid-campaign, or a pixel fires on the wrong event and the data looks clean until you try to compare it across channels. A rigorous workflow starts by standardizing source/medium taxonomy, enforcing UTM conventions, and validating tags in the data layer before analyzing GA4 traffic acquisition. That prevents ambiguous values and attribution drift, then makes path analysis and conversion recovery possible later. WebEyez's traffic sources guide is blunt about this governance layer, and it's the right instinct.
For a crowdfunding launch, the safest move is to lock the naming system before any ad goes live. Use lowercase, avoid spaces, and decide upfront what counts as a source, medium, campaign, and creative. A board game launch, for example, might separate ad sets by audience while keeping the campaign name fixed, so the reporting stays readable when the campaign picks up scale.
| UTM Parameter | Convention | Example |
|---|---|---|
| utm_source | Canonical source name | meta |
| utm_medium | Channel type | paid |
| utm_campaign | Launch or phase name | spring_launch |
| utm_content | Creative or variant label | video_a |
| utm_term | Optional audience or keyword label | lookalike_players |
That table only works if everyone sticks to it. Volunteers, contractors, and creator partners should never invent new names because one creative missed the brief. The entire point is to keep the report sortable by source so you can compare one ad set to another without cleaning the spreadsheet every night.
Pixel setup needs the same discipline. Meta, TikTok, Google Ads, and Klaviyo should fire on confirmed landing-page events, not vague pageviews that happen to look active. For conversion plumbing, the cleanest workflow is to test the landing page, verify the event fires, then make sure the attribution parameters survive the visit from ad click to form submission to pledge manager handoff. If you want a practical build sequence, this conversion setup guide is worth keeping open while you wire the stack.
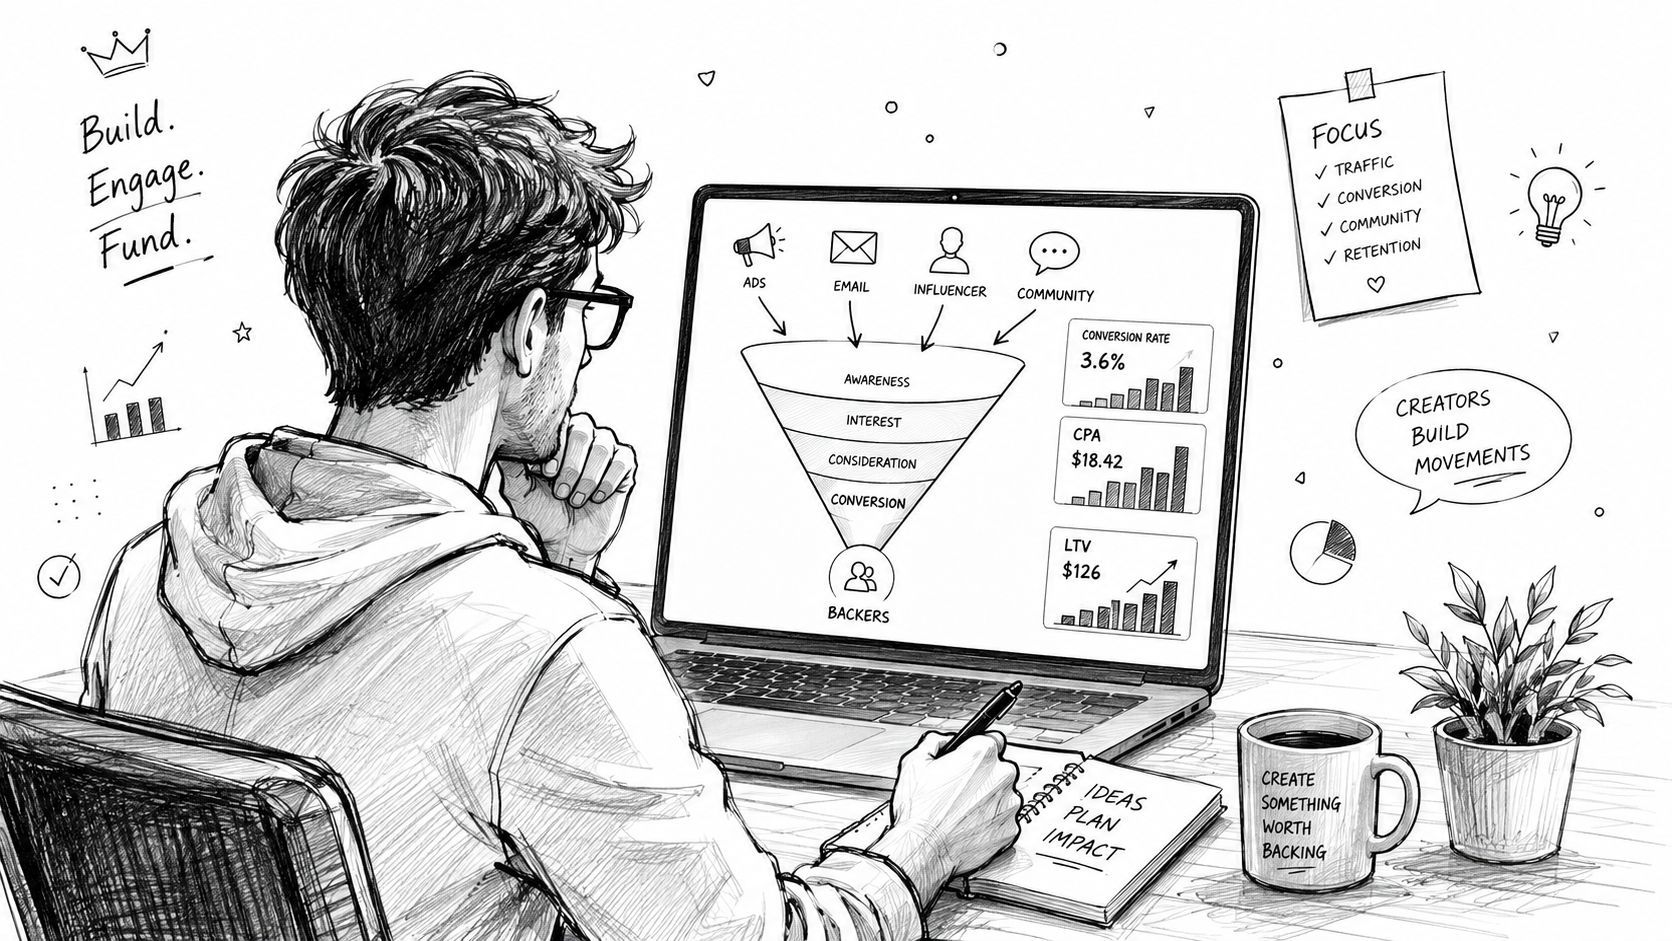
Traffic volume is the first number people notice, and it is usually the least useful one on its own. A burst from a viral post can bring in plenty of sessions and still underperform a smaller email drop if those visitors were never close to pledging. Source analysis works better when you read the stack in order, volume first, then conversion rate, then CPA, then LTV, because each layer changes what the click count means.

A channel can look fine in a dashboard and still hurt the campaign once acquisition cost and backer value are included. For crowdfunding, that gap shows up fast in late-pledge windows, in creator communities that arrive as dark traffic, and in referral paths that never get tagged cleanly. I've had campaigns where Discord chatter drove real pledges, but the sessions landed as direct because people came back later on their own. That is why a source with strong traffic can still be a bad buy if it takes too much spend to acquire each backer. If you need a clean reference for customer acquisition cost math, this customer acquisition cost guide is a useful companion while you read the report.
For benchmark context, traffic mix varies by business type, and a low paid share does not automatically mean weak performance. For early-stage B2B SaaS, organic search often accounts for 25% to 35% of traffic, paid search 15% to 25%, social media 5% to 15%, email 10% to 20%, direct 20% to 30%, and referral 5% to 15%. For B2C ecommerce, organic search is often 30% to 40%, paid search 20% to 30%, social media 10% to 20%, email 15% to 25%, direct 10% to 20%, and referral 5% to 10%. The lesson from Count's traffic source analysis reference is simple, a source mix that looks small in volume can still carry the campaign if the visitors convert and stay valuable.
If a source sends a lot of visits but the conversion rate stays weak, the problem is usually audience quality, landing-page mismatch, or both. If CPA climbs while LTV stays flat, the channel is paying more to bring in backers than those backers return. If a smaller source sends fewer visits but those backers pledge more often or add higher-value support in the pledge manager, that source deserves attention even if it never becomes the loudest line in the report.
The cleanest read starts with traffic quality, not raw counts. Unique-visitor quality matters because repeat clicks can make a channel look healthier than it is. Geography and device mix matter too, especially for Kickstarter campaigns where backers may discover the project on mobile, return later on desktop, or re-enter through a late-pledge page after the main campaign closes. Bot-heavy sessions, mismatched regions, and the wrong device mix all distort the comparison.
For a tighter framework on the conversion side, find a CRO playbook and compare it against your own landing-page behavior. Source analysis only helps when it connects the channel to the outcome, not just the session count.
A source with fewer visits can still be the most valuable source if it converts consistently and brings higher-quality backers.
The decision rule is go, keep, or pause. Go when a source shows strong value and stable tracking. Keep when the data looks promising but is not decisive yet. Pause when the channel is noisy, expensive, or distorted by bot traffic, geo mismatch, or the wrong device mix.
GA4 is where a lot of campaign intuition either gets confirmed or exposed. The report most creators need lives under Reports > Acquisition > Traffic acquisition, and the default view starts at Session default channel group. That view is useful for a broad read, but it hides the detail you need when a campaign starts behaving strangely. You can switch the primary dimension to Session source / medium and add Session campaign as a secondary dimension with the plus sign, which turns a channel bucket into a readable source map. Semrush's GA4 traffic sources walkthrough lays out the interface clearly.
Creators often over-read spikes in direct traffic. In practice, some of that demand comes from Discord, Reddit, podcasts, newsletters, live demos, and creator mentions that get remembered later, then typed in or revisited without a clean click path. Orbit Media explicitly lists offline advertising, word of mouth, podcasting, and live formats as traffic sources that matter beyond standard digital channels, and that's the gap many crowdfunding teams run into when a campaign is heavily community-driven. Orbit Media's traffic sources overview is useful for that broader lens, especially when the traffic source report seems too neat to be true.
The way to handle this is not to pretend those visits are cleanly attributable. It's to build a dashboard that separates what GA4 can see from what the campaign created off-platform. If a community launch event drives branded search and later direct visits, GA4 will often show the outcome but not the whole story.
That's where assisted conversion thinking helps. One source opens the door, another source closes the pledge. If you only credit the final click, you end up cutting channels that did the early work. For a practical growth framework that keeps the whole funnel in view, modern growth marketing system is a solid companion read because it treats channel behavior as a sequence, not a single moment.
A creator dashboard should answer a short list of questions fast. Which source is up, which source is down, which campaign is converting, and which channel needs a landing-page fix? If that takes twenty minutes every morning, the report is too complex.
The working habit is simple.
The creator who uses GA4 well isn't trying to make the report pretty. They're trying to see whether the campaign is still telling the truth.
See how GA4-style performance reporting connects campaign data to decisions
Once traffic is tagged and GA4 is clean, the attribution job isn't done. Backers don't stop being valuable after the pledge, and source data usually dies right when the creator needs it most, during the survey, add-on, and fulfillment stages. The fix is to carry the original source into the pledge manager so the post-campaign report can compare conversion, add-on uptake, and average pledge value by source without guessing later. That is where post-campaign survey enrichment matters more than many teams expect.
The cleanest workflow is to push UTM parameters into the backer record, then surface them in the post-campaign survey. That lets you compare source-level behavior after the pledge, not just before it. If a creator drove traffic through a podcast mention, a creator partnership, or a live demo, the survey can also capture a simple how did you hear about us response and help reconcile dark traffic against the UTM trail.
That matters because some of the most important discovery happens off-platform. A backer might hear about the campaign in a community or at an event, then return later through direct traffic or branded search. If the survey is carrying the source data forward, the campaign can still see that assisted influence instead of losing it in the gap between website and fulfillment.
Source-level reporting in the pledge manager should not stop at survey completion. It should show which sources brought the most valuable backers, which sources bought add-ons, and which sources produced the best average order behavior after the campaign ended. That is the difference between a report that confirms activity and a report that changes next year's budget.
The setup is also easier when the system is built for attribution handoff. If you're comparing stack options or integration patterns, integrations for social commerce is a useful reference point because it shows how operational data moves across systems instead of disappearing at checkout.
The operator mindset here is straightforward. Tag the ad. Capture the UTM. Push it into the pledge manager. Read the source-level upsell report. If the source can't survive that whole path, it isn't really tracked.
Crowdfunding teams often compare the built-in pledge manager experience to a storefront. Kickstarter's pledge manager feels more like Amazon, transactional and fixed in how it behaves, while a configurable pledge manager such as PledgeBox behaves more like Shopify, where the branded survey and add-on flow can be tuned to increase average order value. That distinction matters because source analysis only becomes financially useful when it reaches the upsell layer.
Source analysis becomes useful when it changes spend. In pre-launch, the job is to seed the waitlist with the cheapest source that still attracts the right audience. In the live campaign, the job is to watch CPA per pledge closely enough to reweight spend before the budget burns. In the post-campaign window, the job is to use the best sources to drive add-ons, late pledges, and fulfillment-stage revenue.
The main mistake creators make is treating all three phases as one funnel. They aren't. A source that's great for list growth might be mediocre for immediate pledges, while a smaller referral source may produce the highest-value backers once the campaign moves into add-ons. The only way to see that is to separate the phases and read the source data inside each one.
During pre-launch, favor the channel that fills the waitlist without polluting it. During the live campaign, shift budget toward the sources that convert efficiently and keep the pledge curve moving. After funding, give the strongest sources a second look, because those backers often respond best to add-ons and post-campaign offers.
That's also where source-level LTV changes budget logic. If a source produces better backer quality, it deserves a larger share of next year's plan even if the campaign itself was modest. If a source looks busy but never closes, retire it. Busy is not the same as profitable.
Practical rule: measure each source against the phase it actually serves, not the phase you wish it served.
The cost model matters too. PledgeBox is free to send the backer survey and only charges 3% of upsell revenue if there's any, which keeps the attribution conversation focused on margin instead of fixed overhead. That pricing structure matters in crowdfunding because the most valuable source data often shows up in the post-campaign upsell layer, not just in the initial pledge.
Creators who ignore that layer usually undercount the sources that built trust early and overcount the channels that created a spike on launch day. The better approach is to use source analysis to decide where to invest for the next campaign, then let the survey and upsell data tell you which channels paid off all the way through fulfillment.
Five problems show up again and again in crowdfunding analytics. The first is inconsistent UTMs, which makes the same source appear under multiple names. The fix is to lock the taxonomy and make one person responsible for it.
The second is broken pixel events on the pledge button. If the event doesn't fire at the right step, you lose the connection between ad click and conversion. The third is missing cross-domain tracking between the pre-launch page and Kickstarter, which can split one user journey into two unrelated sessions.
The fourth is treating direct traffic as one bucket. That hides community-driven discovery, podcast mentions, and offline influence. The fifth is ignoring assisted conversions, which causes creators to cut the very channels that started the pledge journey.
A creator who runs this checklist stops arguing with the dashboard and starts using it. That's the whole point of traffic source analysis in crowdfunding, to make channel decisions that survive pre-launch, live funding, and post-campaign upsell revenue.
PledgeBox helps crowdfunding teams keep source data attached from survey to fulfillment, so you can see which channels create valuable backers instead of just busy traffic. If you're ready to turn attribution into better pledge manager decisions, visit PledgeBox and see how a cleaner post-campaign workflow can make your next launch easier to measure and easier to grow.

The All-in-One Toolkit to Launch, Manage & Scale Your Kickstarter / Indiegogo Campaign