 PledgeBox
Campaign Analysis Report: How to Read and Build One
Learn what a campaign analysis report includes, which KPIs to track, how to read results and attribution, and how to review post-campaign revenue.

Learn what a campaign analysis report includes, which KPIs to track, how to read results and attribution, and how to review post-campaign revenue.
You closed the campaign three nights ago, and the only number you keep opening is the funding total. It looks fine. The goal was met, backers thanked you, and the comments feel warm. Then the survey starts coming back, a region underpays shipping, and two reward tiers generate a pile of support messages. The total that felt like a win starts to look thinner once you subtract what it will cost to deliver.
A campaign analysis report is the replay that stops you from treating that total as the whole story. It fixes a period, lines the results up against targets, and turns each number into a decision about budget, creative, and fulfillment.
After a match, a coach does not stop at the final score. The coach watches the footage, marks the plays that created chances, and notes the ones that leaked goals. A campaign analysis report does the same job for a crowdfunding campaign. It is a structured review of what happened from the pre-launch page through fulfillment, why the results looked the way they did, and what you change next time.
Say a founder funded at 126% and treated that as the verdict. The report would still ask which week the pledges arrived, which email closed them, and whether those backers later paid shipping. Without that footage, the next campaign repeats the same mix of spend and offers.

Three people read it for different decisions.
A live dashboard shows numbers while they move. A report freezes a period, compares results with targets and a prior campaign, explains the cause of the change, and ends with named recommendations. For crowdfunding, the usual scope runs across five phases: pre-launch audience building, the launch window, reminder emails, the final push, and the post-campaign survey and add-on stage.
Practical rule: If a number cannot change a budget, a message, or a shipping plan, it does not belong in the headline.
By the end of a careful read, you will know what the report contains, which numbers matter most, how to read them without overreacting to one day, and how to close the loop with a dated review.
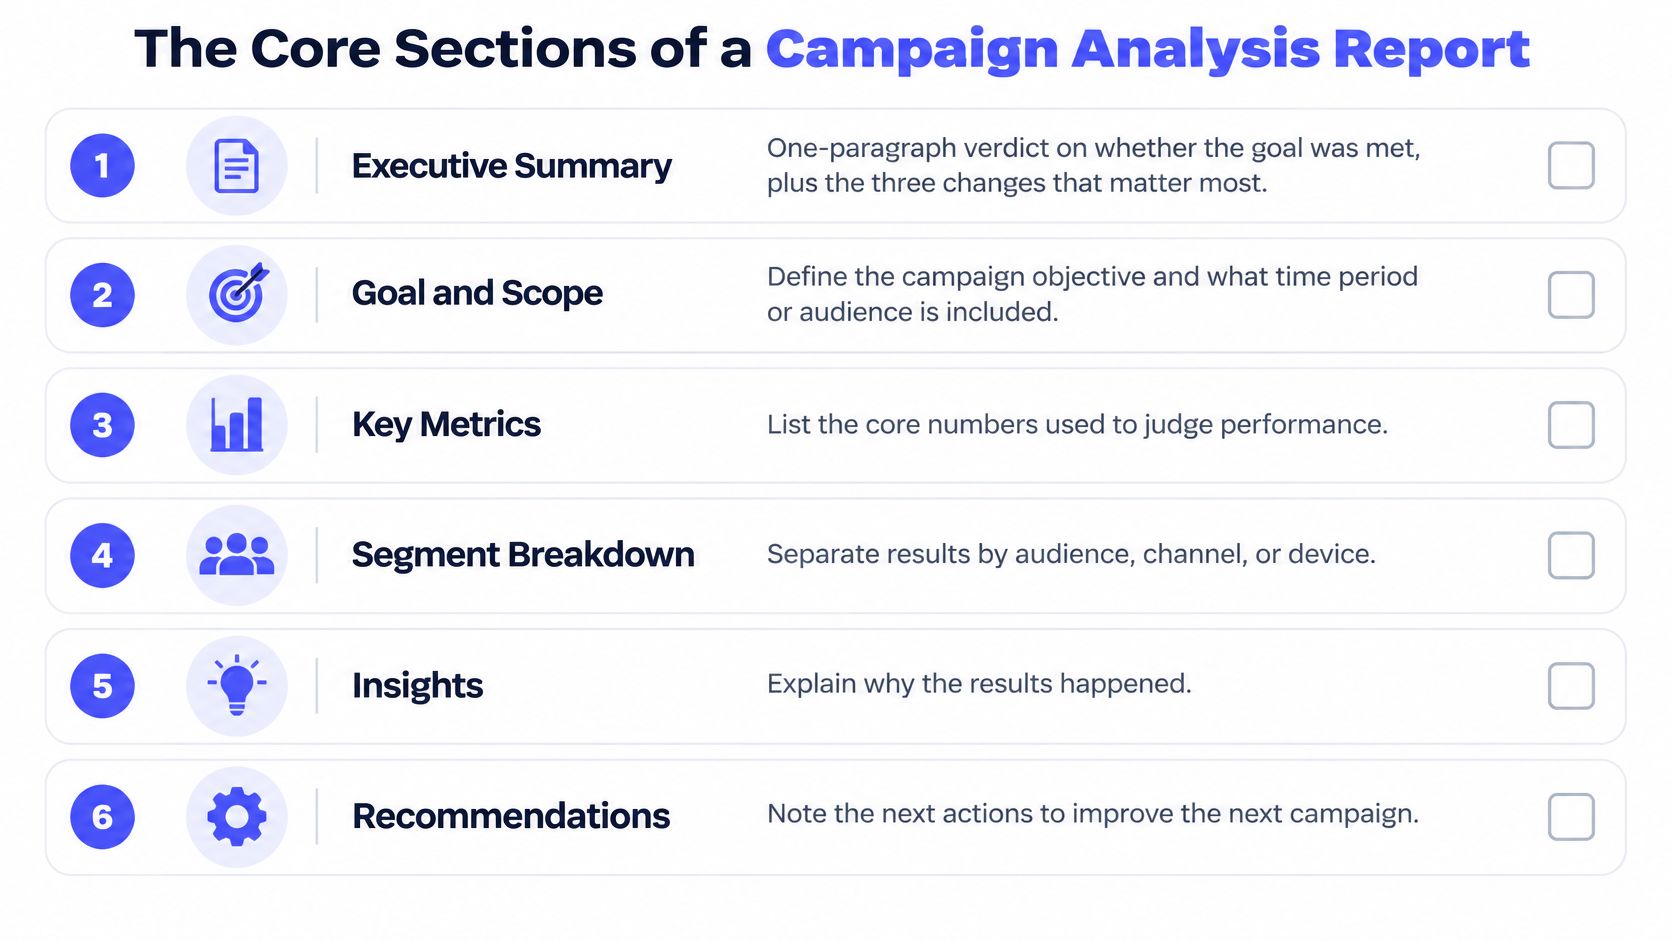
Copy this outline before you export a single chart. Each block answers a different question, so a figure should appear in two places only when the second place changes the decision.
If you also buy on Meta, the same discipline shows up when you build actionable Facebook advertising reports that tie spend to a defined conversion instead of a pile of platform totals.
| Section | Reader question it answers | Content to include |
|---|---|---|
| Executive summary | Did the campaign work, and what changes first? | Verdict, funding outcome, top three changes |
| Scope and attribution rules | What period and credit rules sit behind the numbers? | Dates, phases, conversion event, attribution model |
| Acquisition by channel | Which sources bring visitors who convert? | Spend, reach, clicks, conversion rate, cost per acquisition |
| Funding performance | How fast and how large was the funding? | Pledges, backers, average pledge, funding velocity, time to goal |
| Segment breakdown | Where do the strongest backers come from? | Device, country, referral source, reward tier |
| Post-campaign revenue | What did the campaign earn after it closed? | Add-ons, shipping collected, taxes, refunds, survey completion |
| Lessons and next actions | What changes in the next campaign? | Changes ranked by impact, owner, deadline |
A short walkthrough of how teams turn those blocks into a recurring review helps if you have never built the file from scratch.
Read the table from top to bottom once, then fill it in that order. Skipping scope and writing the summary first is how two people end up defending two different campaigns with the same spreadsheet.
Volume and value are not the same story. Visitors, email subscribers, and clicks tell you whether the campaign created attention. Pledge conversion, average pledge, and cost per acquisition tell you whether that attention became something you can fund production with.
HubSpot's marketing statistics report that 44% of marketers analyze campaign performance weekly, and they put conversion-oriented measures near the top of what teams use: lead quality or marketing-qualified leads at 39%, lead-to-customer conversion rate at 34%, return on investment at 31%, customer acquisition cost at 30%, and lead-generation volume at 29%. For a crowdfunding page, the matching ladder runs from landing-page visitors and subscribers to notified launch users, backers, average pledge, acquisition cost, and funded amount. Keep later upgrades and late pledges in a separate line so launch fundraising is not mixed with money that arrives after close.
Weekly review matters because a slipping channel can still lose or gain budget before the final week. Social follower counts and raw likes are weak stand-ins for incremental pledges. Judge a source by qualified visits, email capture, and pledge conversion. The same habit applies when you are tracking influencer engagement and performance: a creator post earns its place only if the clicks become pledges, not if the comments look lively. A tighter set of campaign performance metrics keeps that ladder in one place while the campaign is live.
| KPI | How to calculate | What it tells you | Review cadence |
|---|---|---|---|
| Landing-page conversion rate | Email signups divided by unique visitors | Whether the pre-launch page turns attention into interest | Weekly |
| Cost per acquisition | Ad spend divided by backers from that channel | Whether a source earns its budget | Weekly |
| Average pledge | Total pledged divided by number of backers | Whether offers and tiers attract higher-value backers | Weekly |
| Funding velocity | Pledged amount per day over a rolling window | Whether momentum is building or fading | Daily during launch |
| Return on ad spend | Pledge value divided by ad spend | Revenue return per channel dollar on a stated attribution basis | Weekly |
| Email click-to-pledge rate | Pledges divided by email link clicks | Whether reminders convert subscribers | After each send |
Compare each row with the target and with the prior campaign, not with yesterday's total alone. A channel can win on clicks and still fail the cost-per-acquisition row. That is the row that should move the budget.
Refunds, survey completion, and shipping shortfalls wait until after close. Tracking them in the same weekly meeting as live ads makes the meeting too wide, and teams start ignoring the numbers they can still change this week.
Maya saw a short video on Instagram in week one, opened the launch email, got a reminder on day 25, and pledged from that reminder link. Last-touch gives the email all the credit. First-touch gives Instagram all the credit. Both touches mattered, and a report that picks only one will fund the wrong habit next time.
Google's marketing attribution white paper treats attribution as the job of deciding what role each channel played in informing and influencing the journey, and its reporting lets teams compare key-event counts and revenue under different models. A campaign's apparent performance can change a lot when credit moves from the first interaction to the last, or when it is shared. The same split runs through pre-launch, launch, reminders, referral traffic, and later upsell activity. At minimum, document spend, reach, clicks, conversion rate, cost per acquisition, pledge value, and return on marketing investment, and name the model behind every headline.
An awareness channel often introduces a backer who converts later through email. The final reminder then collects the last click. Reporting only that final source understates the audience you spent weeks building. Platform-reported conversions often use the platform's own rules, so do not paste them next to your model without a label.
| Model | How credit is assigned | Best used for | Main blind spot |
|---|---|---|---|
| First-touch | All credit to the first channel a backer met | Finding which sources create awareness | Ignores the reminder that closed the pledge |
| Last-touch | All credit to the final channel before the pledge | Spotting closers such as reminder emails | Undervalues awareness channels |
| Linear | Equal credit to every touchpoint | Seeing the full journey evenly | Treats a minor touch the same as a decisive one |
| Time-decay | More credit to touches close to the pledge | Short, urgent final weeks | Can hide early audience building |
| Position-based | Heavy credit to first and last touches, the rest shared | Balancing discovery and closing | The split is a convention, not evidence |
| Data-driven | Credit weighted by modeled contribution | Large campaigns with enough conversion volume | Needs sufficient data and is hard to audit |
Show at least two models side by side, and state which one produced the headline number. A single-model report tends to starve awareness and overfeed reminders, which then receive budget they did not fully earn.
Name the conversion event in the same sentence as the model. "Last-touch on a completed pledge" is a rule. "Email won" is a slogan.
If you want a worked view of how referral paths change that verdict, start with traffic source analysis before you lock the budget split for the next launch.
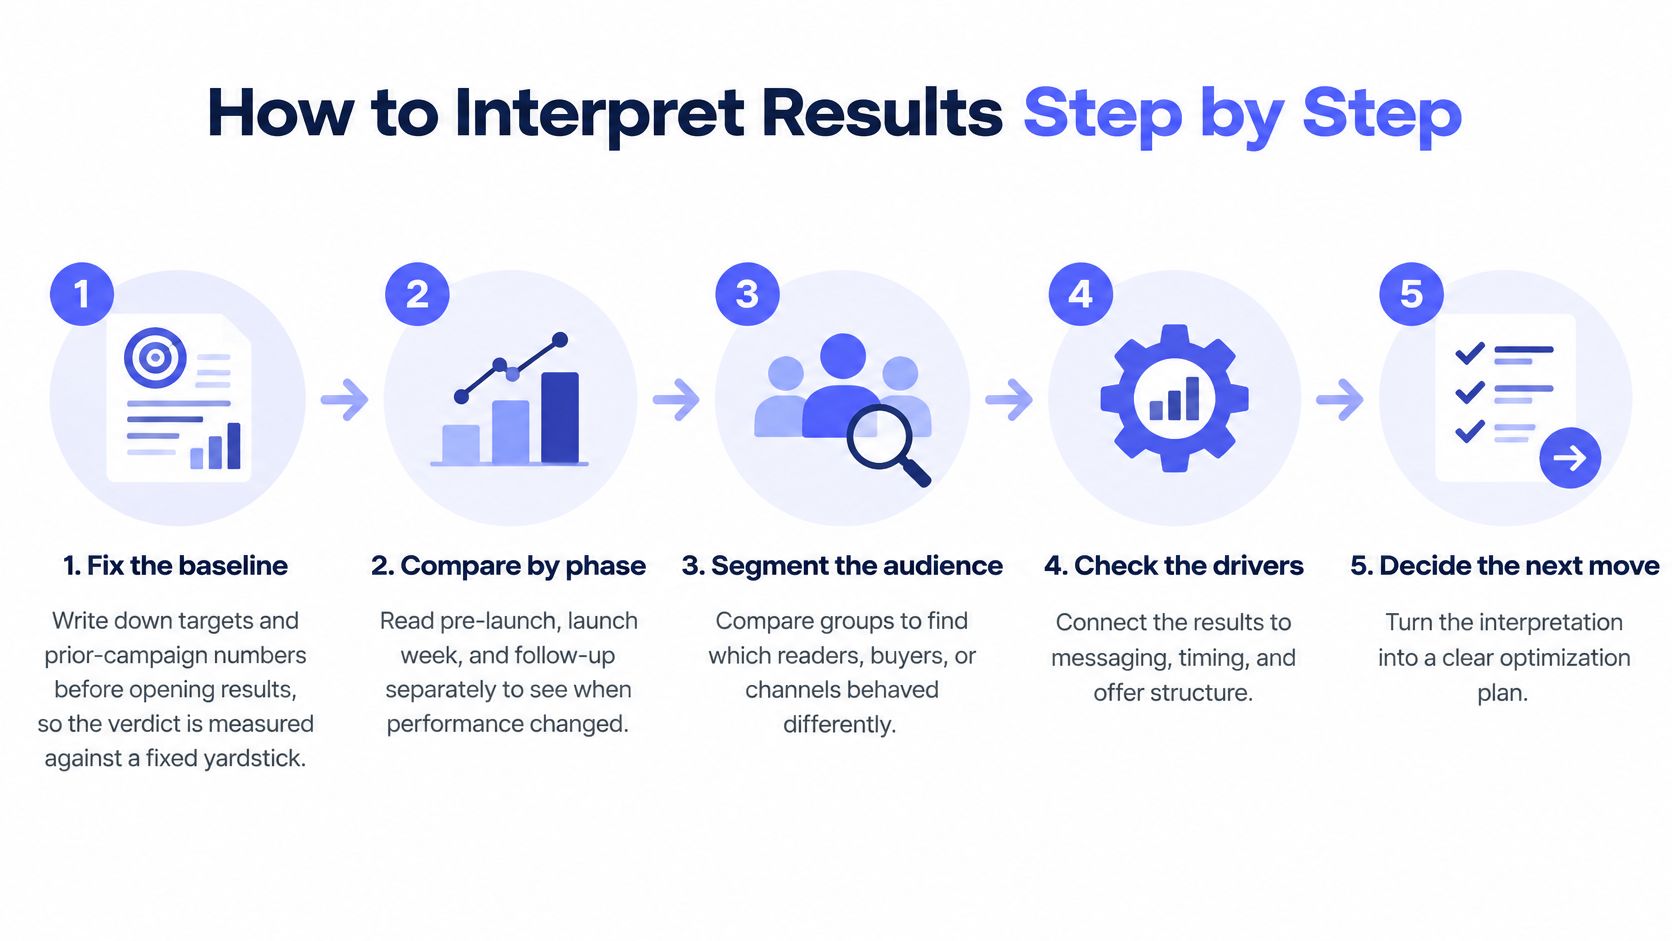
Open the file only after the yardstick is written down. Otherwise the first surprising chart becomes the story.
1. Fix the baseline. Write targets and prior-campaign numbers before you open results. A verdict measured against a number you chose after seeing the chart is not a verdict. It is a mood.
2. Compare by phase. Read pre-launch, launch week, the middle weeks, and the final push as separate blocks. A blended total hides how momentum changed by week, and that is the week your next creative has to fix.
3. Read velocity against time to goal. A campaign at 40% of goal on day 10 can be healthy if daily pledges are rising. A flat line on day 20 is a problem even if the percentage still looks respectable. A study of 335 reward-based crowdfunding projects and 33,036 investment decisions treated the number of funders as a significant success indicator and found significant associations with campaign location, creator experience, human capital, and gender. Funder growth and time to goal carry a warning a final funding percentage does not. Calculate daily new backers, pledge per backer, and cumulative funding velocity, then compare them by traffic source, reward tier, and geography.
4. Segment by source and tier. Look for channels that bring higher average pledges, not just more clicks. A smaller email list can beat a large paid audience on value per backer.
5. Test one cause at a time. Change the subject line or the reward price, not both, before you conclude that "the new creative worked." Those regression results show association, not guaranteed causality. Treat them as warnings, not proof.
6. Write the verdict with a confidence level. Mark it high, medium, or low, and state what the data cannot prove. Low confidence is still a useful output when the sample is a few dozen backers in one country.
Two traps catch careful people. A follower spike is not demand until those people pledge. A single strong day is not a trend until the next two days agree. When either trap shows up, go back to velocity and the phase split before you move budget.
The funding total is not the result. It is the gross before surveys, shipping, taxes, add-ons, refunds, and support work decide what is left.
Kickstarter's 2025 product roadmap put integrated pledge management and stronger backer surveys on the product path, which is a signal that production-ready backer data belongs in the campaign lifecycle, not in a side spreadsheet. Survey response rate and the share of rewards shipped are post-funding signals, not admin trivia. The questions that change margin are cohort questions. Which acquisition sources produce backers who complete surveys and pay shipping? Which tiers create the heaviest support load? Does late revenue offset a soft launch week, and do refunds or failed payments erase that gain?
Group backers by the source that brought them. A channel with many pledges and few survey responses delays shipping and inflates support. Hardware, tabletop, and international campaigns often lose the marketing win to shipping shortfalls, taxes, and customs friction. A practical revenue reporting view should connect each cohort to add-on revenue, shipping collected versus shipping cost, survey completion, refunds, and repeat backing.
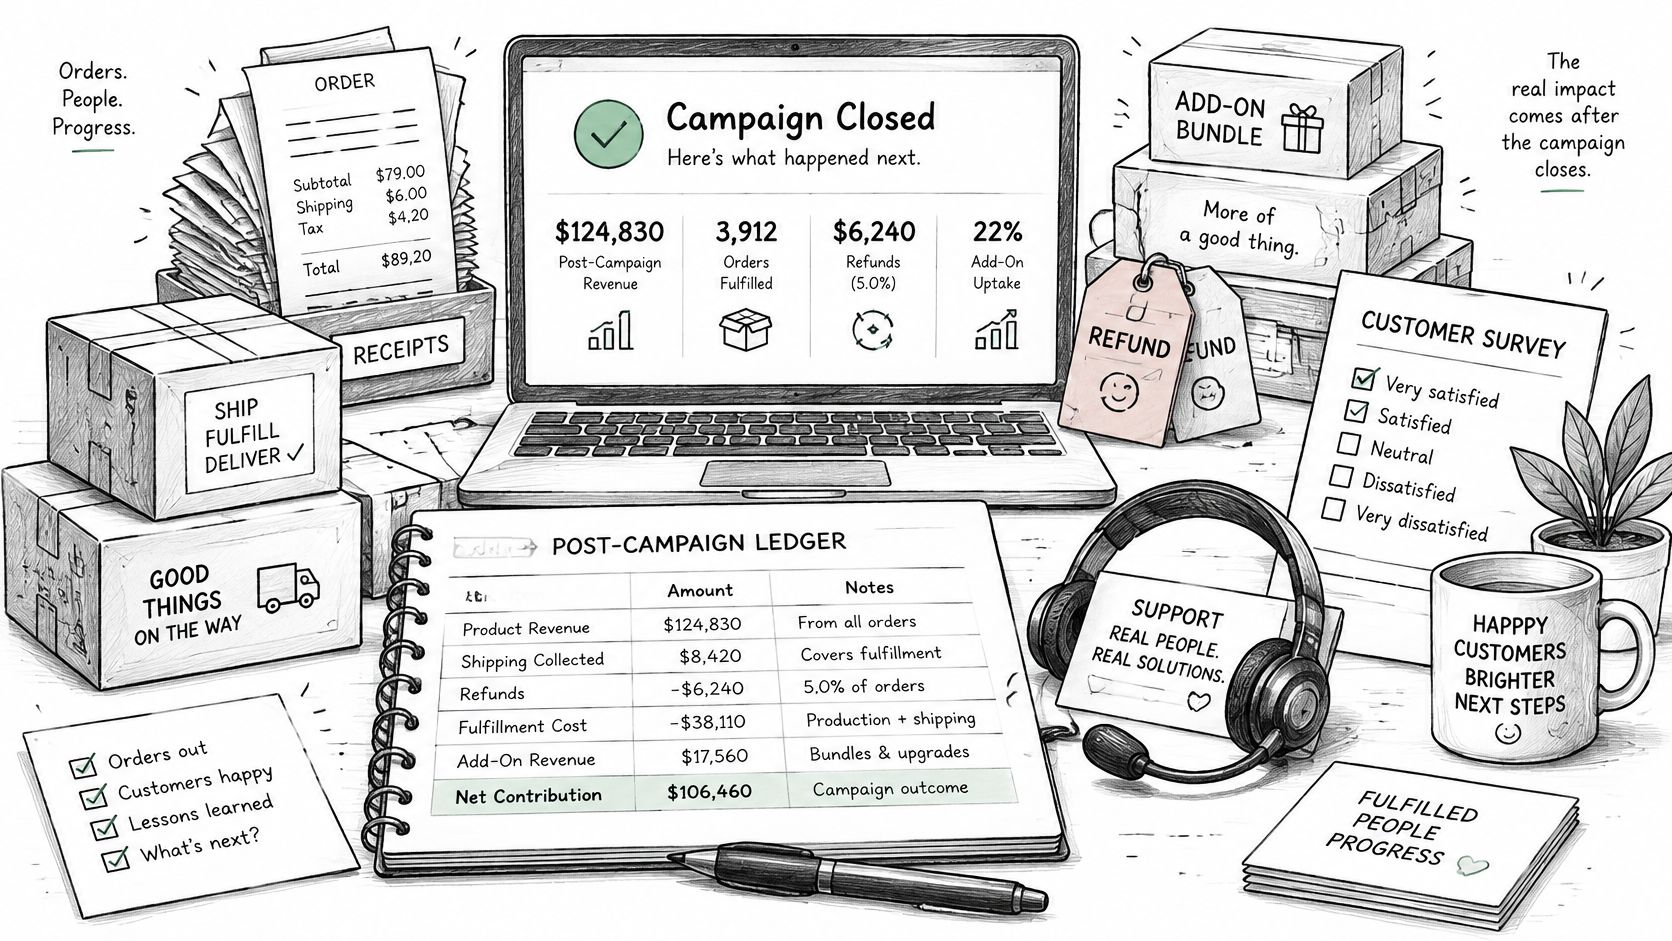
| Metric | What it reveals | Warning sign |
|---|---|---|
| Survey completion rate | Whether backers will provide addresses and choices | Slow responses that delay shipping |
| Shipping collected versus shipping cost | Whether shipping fees cover fulfillment | A shortfall per backer in one region |
| Add-on revenue per backer | Whether upsells add margin after close | Flat revenue despite survey sends |
| Refund and failed-payment rate | How many pledges unwind | Rising after reward or price changes |
| Contribution margin by cohort | Which acquisition sources produce profitable backers | Strong pledges with weak margin |
When a region shows a shipping shortfall, the Sendaparcel guide to cheaper shipping is a useful companion to the rate card, because a cheaper lane only helps if the fee you collected still covers it.
Judge the campaign by contribution margin and fulfilled backer value, not by the headline funding number.
Late add-on revenue can offset a weak launch day. Show both lines. If you only rank channels by pledges, you will buy more of the traffic that is expensive to fulfill.
The figures below are a sample, built so you can see how one campaign reads once pledges, surveys, shipping, and refunds sit in the same file. They are not a benchmark.
Executive summary. Goal of 25,000 was met on day 19, with 31,400 pledged from 412 backers. Confidence is high on the funding outcome and medium on channel credit, because two models disagree on paid social. The first change is to move budget from paid social toward the reminder email. The second is to raise the shipping fee in the region that missed cost. The third is to rewrite the mid-tier reward, which drove most refunds.
Scope and attribution. The window covers pre-launch, launch week, the middle, the final push, and the survey. The conversion event for acquisition is a completed pledge. Last-touch and position-based credit are shown side by side. Email leads on last-touch. Position-based gives the pre-launch video a real share.
Acquisition. Email cost per acquisition was 4.10. Paid social was 11.80. Email reached a smaller list, produced fewer clicks, and converted a higher share of those clicks. Paid social bought reach and lost on cost per backer.
Funding. Average pledge was 76. Velocity ran about 1,400 per day in launch week and fell to about 600 in the middle. The goal landed on day 19, which matched a rising final-week line rather than a single spike.
Post-close. Surveys completed: 318, or 77%. Shipping collected: 1,900. Shipping cost: 2,350. Refund rate: 2.4%. The shipping gap is the warning for the next campaign, even though the pledge total cleared the goal.
Lessons. Maya owns the budget shift, due before the next ad account is funded. The fulfillment lead owns the regional shipping fee, due before the next reward lock. The founder owns the mid-tier rewrite, due at the next reward review. Each action has a date because an unowned lesson does not change the next launch.
Set the calendar before you set the ads. Hold a weekly review while the campaign is live, one review on the day it closes, and a final review when shipping ends. Lock the conversion events, the attribution model, and the template sections now, so the export arrives in the shape the report expects.
Then pick the tool that will collect the post-close numbers. Kickstarter's Pledge Manager is like Amazon: an integrated checkout inside the Kickstarter ecosystem that handles pledges, upgrades, add-ons, taxes, shipping, and payments. PledgeBox's pledge manager is like Shopify: a separate, configurable storefront and survey setup for managing post-campaign orders and monetizing add-ons.
PledgeBox's pricing makes sending the backer survey free when you only collect addresses and product choices. We charge 3% only on additional payments collected through the survey, such as add-ons, shipping fees, or taxes and VAT. If there are no upsells, the survey stays free.
Build the survey before launch. Our Campaign Manager already puts campaign rank, traffic sources, pledge velocity, and backer trends on one dashboard, and InBox tracks clicks, conversions, and engagement across every campaign you send. Separate workspaces for pre-launch, the live campaign, and email marketing keep those three reviews from sharing one messy list. Configure products, reward mapping, shipping, tax, and payment settings, preview the backer path, and clear any blocking checklist items before the first invitation goes out. A survey that waits until after funding will not have clean cohorts when you sit down to judge margin.
PledgeBox gives crowdfunding teams one place to watch pledge velocity, send the backer survey, and read add-on and shipping results after the campaign closes. If you want the next campaign analysis report to include fulfilled backer value instead of a funding total alone, start with the survey and the live dashboard before launch day. Visit PledgeBox and set up the review while the backer list is still easy to shape.
PledgeBox
The All-in-One Toolkit to Launch, Manage & Scale Your Kickstarter / Indiegogo Campaign