 PledgeBox
Technology Stack Optimization: A Step-by-Step Guide
A practical guide to technology stack optimization: audit your tools, track four delivery KPIs, cut hidden costs and plan a safe migration.

A practical guide to technology stack optimization: audit your tools, track four delivery KPIs, cut hidden costs and plan a safe migration.
Your campaign funded on a Tuesday. By Friday you're juggling a pledge manager, a survey tool, two spreadsheet exports, a shipping app and a chat widget, and one of them is billing your card every month for a feature nobody has opened since pre-launch. The reflex is to cancel tools until the list looks tidy. The smarter move is to measure what the stack is doing to your delivery speed, then cut with evidence and a date.
Four numbers tell you whether your stack is helping or obstructing you: deployment frequency, change lead time, change failure rate and mean time to restore. Pull them from the last 90 days of deploy logs, ticket timestamps and incident records. For a campaign team, a "deployment" is anything that reaches backers or staff: a new survey question, a shipping rule, a payment setting, a product variant, a fulfillment export.
| Metric | What It Tells You | Elite Performers | Low Performers |
|---|---|---|---|
| Deployment frequency | How often changes reach users | On demand, about 1,460 per year | About 1.5 per year |
| Change lead time | Time from code commit to production | Less than one hour | One to six months |
| Change failure rate | How often a change breaks something | Lower than low performers | Higher than elite performers |
| Mean time to restore | How quickly service recovers after failure | Faster than low performers | Slower than elite performers |
Google Cloud's 2021 Accelerate State of DevOps research shows how wide the gap gets. Elite organizations deployed on demand, roughly 1,460 deployments a year when modelled as four a day, against about 1.5 a year for low performers. Change lead time ran under an hour for elite teams versus an estimated 6,570 hours at the bottom. Those are not targets for a five-person crowdfunding team. They're a picture of what an unobstructed path from change to production looks like.
One slow payment integration hides behind a healthy overall figure. If your survey sends complete in two minutes but your address validation stalls for four hours on international backers, an organization-wide number says everything is fine. Record each metric per service: payment, survey, analytics, shipping export, reporting.
Baseline rule: Write one starting number for each metric, per service, before you cancel anything. Every decision later gets judged against that number.
Speed and stability usually move together, not against each other. The same research found elite performers had lower change-failure rates and recovered from incidents faster, which is why a stack change should improve at least one throughput measure without wrecking failure rate or recovery time. Frequent releases with weak rollback raise risk rather than lowering it.
Attributing an incident to the wrong change is routine, because a failure surfaces minutes or hours after the deploy that caused it. Give every deployment a unique ID, stamp it on tickets and alerts, and use fixed incident windows so correlation is possible. Otherwise you'll retire the tool that happened to deploy last instead of the one that broke.
Fill the table for your own systems this week. One row per service, one number per cell. That snapshot becomes the reference point for everything that follows.
A stack inventory starts as a plain list, not a diagram. Open a spreadsheet and work through six steps.
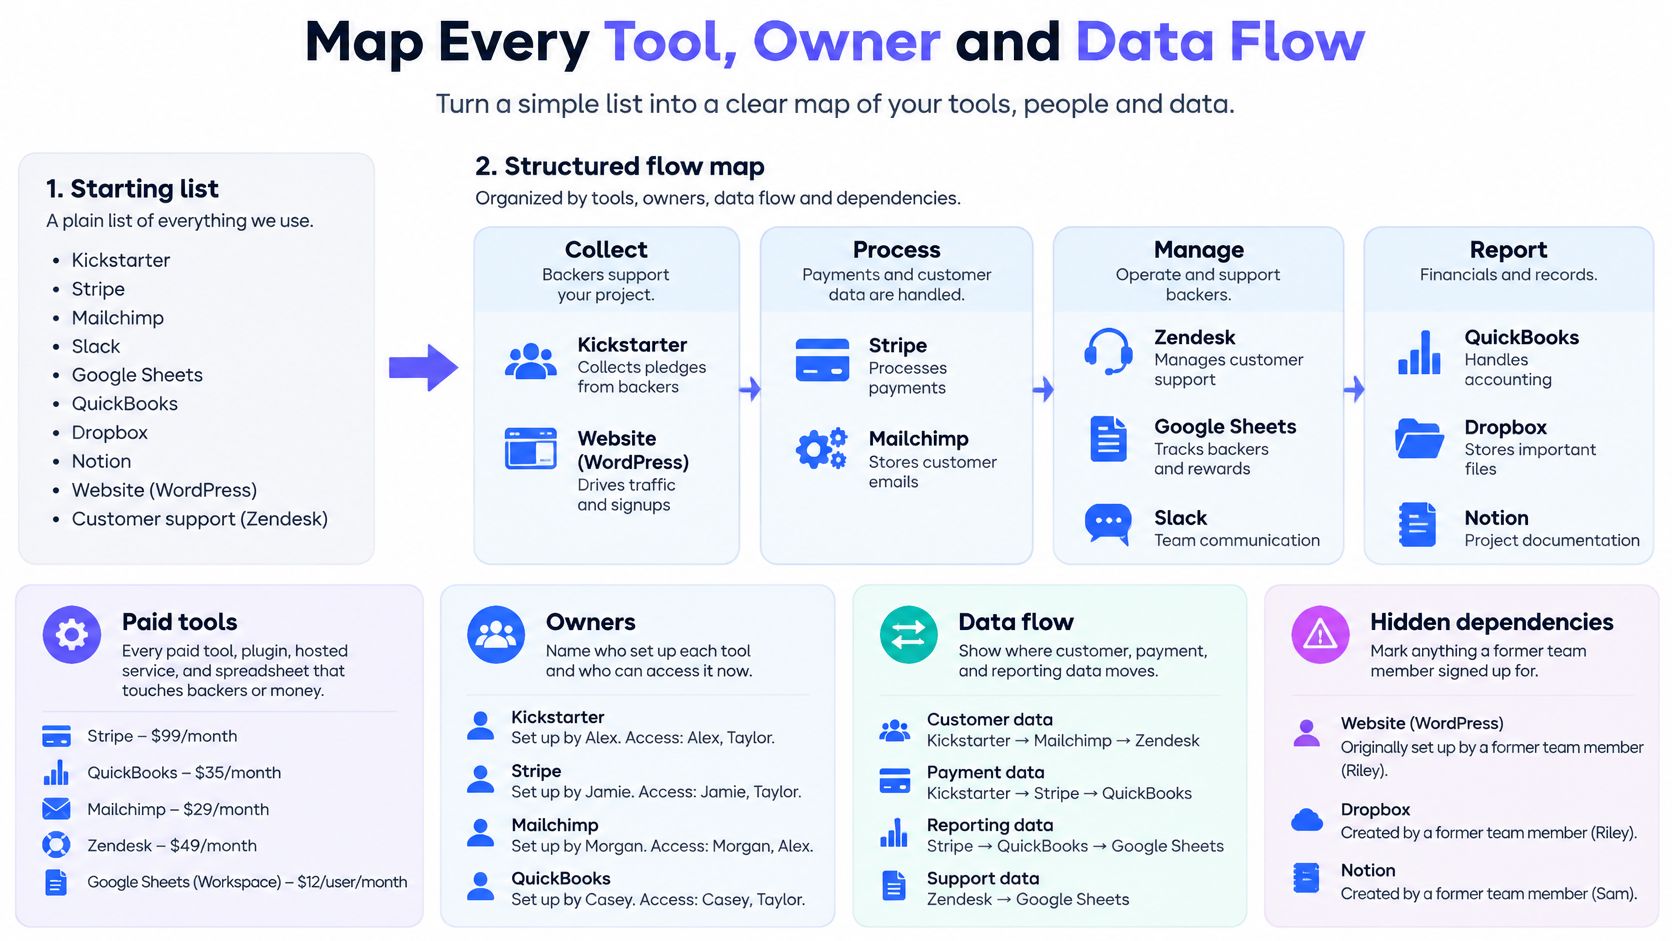
Duplication at this scale is normal, not a sign of incompetence. Nintex's 2025 survey of 2,000 IT decision-makers across Australia, the United Arab Emirates, the United Kingdom and the United States found that 51% of mid-market organizations ran between 100 and 300 SaaS tools in their stack.
The dangerous rows aren't the expensive ones. They're the free tier that became a paid plan, and the workflow held together by a personal automation account nobody else can log into. When fulfillment time comes, the data has to leave cleanly, which is why the export path matters as much as the intake path. Our guide to logistics and shipping integrations covers what a healthy export looks like before orders go to a vendor.
Finish by reconciling the inventory against your actual card and invoice list for the last three months. The tool you forgot is almost always the one still charging you.
Consolidation is a complexity-and-risk problem, not a licence-reduction exercise. Score every component against five criteria, then weight business criticality highest, because a tool whose failure stops pledges or shipping should never be the first one cut.
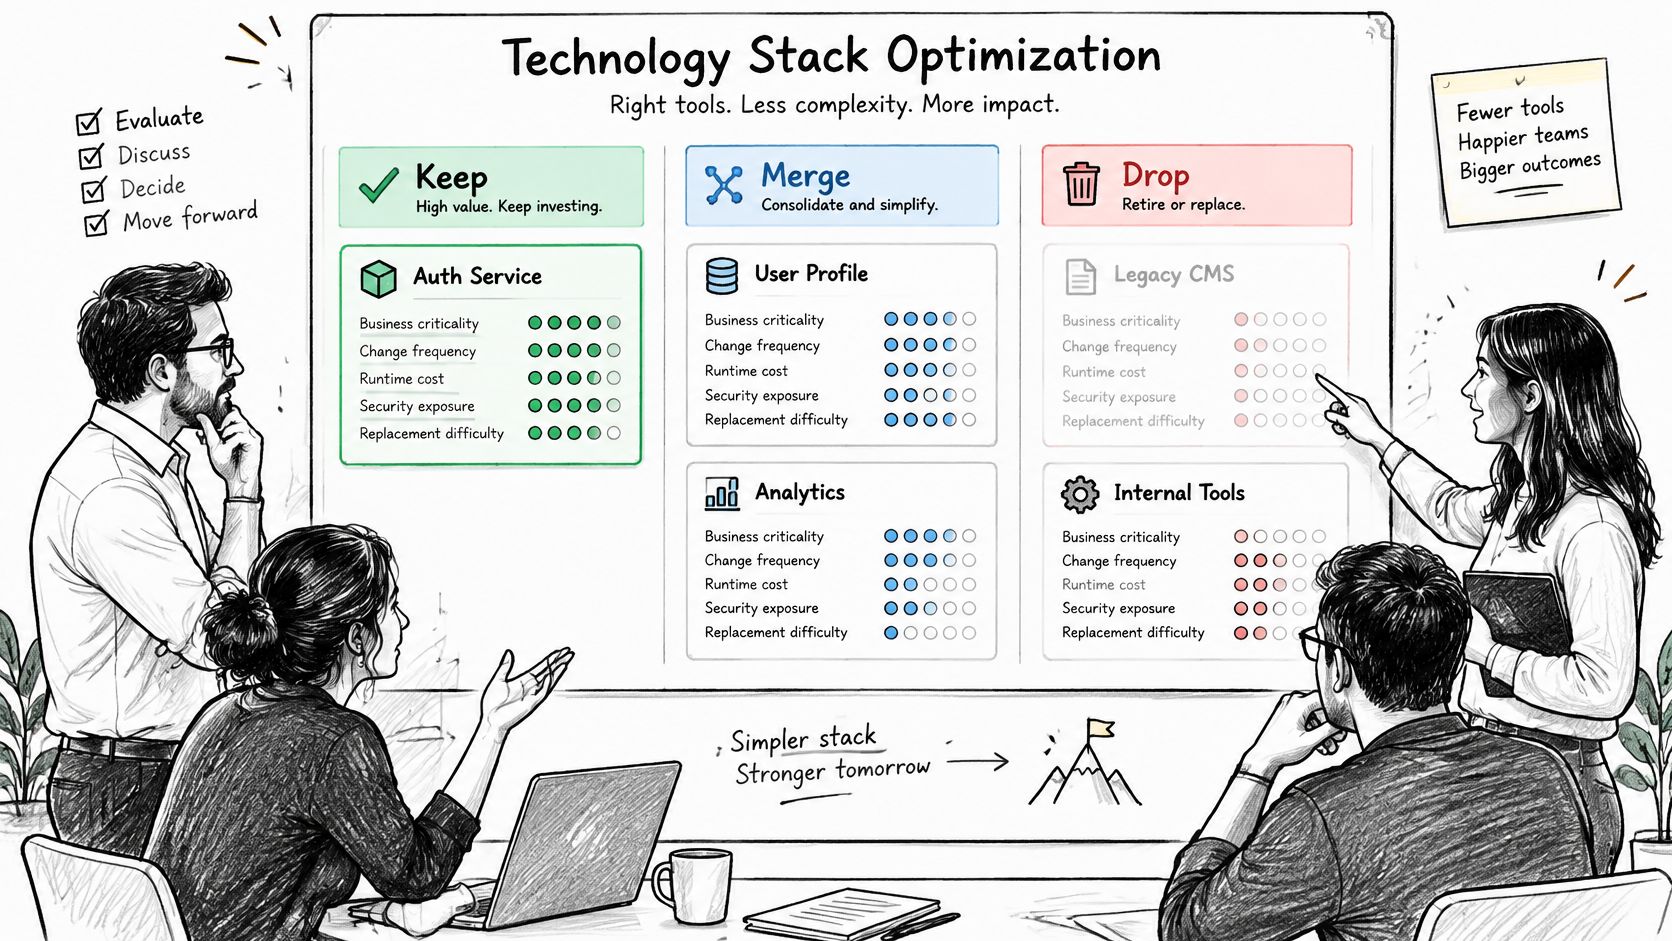
| Criterion | Keep Separate When | Consolidate When |
|---|---|---|
| Business criticality | Failure would stop pledges or shipping | Failure affects only internal reporting |
| Change frequency | Changes often and needs its own release path | Rarely changed and easy to bundle |
| Runtime cost | Cost is low and predictable | Two tools bill separately for the same function |
| Security exposure | Handles payment or identity data under its own controls | Holds only non-sensitive product data |
| Replacement difficulty | Exports are clean and an exit path exists | A neighbouring tool already covers the function |
Maintainability is a selection criterion you can measure. CNCF's 2024 survey names three top production-adoption risks: project inactivity (46%), excessive complexity to understand or operate (46%) and insufficient documentation (45%). Before you keep or add anything, require active releases, a clear upgrade path, runbooks, documented APIs and an exit strategy.
A tool that stops pledges or shipping is never the first one to cut, no matter how much the licence costs.
Take the merge or removal you scored lowest on criticality and run it on internal reporting first. Load it, break it on purpose, restore it from backup, and migrate real records in a test copy. If a reporting tool fails, someone reads a stale number. If a payment integration fails at peak, backers get charged twice or not at all.
Vendors are also pushing AI into the selection process itself. Research conducted by Censuswide for Nintex found that 92% of Australian organizations surveyed said they were deploying AI to detect redundant applications, automate integrations or optimize tool usage, according to coverage of the survey. Useful for spotting overlap. Not a substitute for knowing which system holds the authoritative address list.
The trap on the other side is the all-in-one platform that swallows every function and does three of them badly. A specialist tool with clean exports and a documented API often costs less across a campaign's life than a bundled suite you have to work around.
Score each row for your own stack and mark one candidate for a pilot. One, not five.
Subscription bills lie by omission. Measure total operational burden across the campaign's phases, and record three cost lines per tool: the recurring licence, the one-time migration cost, and the staff hours consumed by training and upkeep.
| Cost Line | What to Record | Why It Matters |
|---|---|---|
| Recurring licence or subscription | Monthly fee and annual renewal date | Savings only appear when the tool is cancelled |
| One-time migration cost | Export, field mapping, test copy and parallel running | Paid once and excluded from subscription totals |
| Training time | Staff hours per new tool | OECD: training was the second challenge for 39% of respondents |
| Maintenance cost | Ongoing upkeep, fixes and upgrades | OECD: the leading challenge for 40% of respondents |
The OECD's 2025 D4SME survey found maintenance costs were the leading digitalization challenge for 40% of small firms, ahead of training time at 39%. A cheap subscription on top of unpaid maintenance isn't cheap.
Pair each cost with one performance KPI: cost per completed pledge, fulfillment exception rate, support hours per month, and the four delivery metrics per service from your baseline. Track the phases separately, because pre-launch setup, the live campaign and the fulfillment tail carry different loads. In the tail, your team has shrunk but the stack still has to run.
Calculate payback before removing anything: divide the one-time migration cost by the monthly saving. A removal that takes six months to repay is worth doing only if the stack stays stable after staff contracts. Review at 30 and 90 days, and log each decision with its cost and measured effect. Our notes on campaign performance reporting show which numbers are worth pulling into that review.
After a campaign closes, survey fees and fulfillment work become separate cost questions. PledgeBox lets creators send surveys without charge. Its 3% fee applies only to add-on sales collected during surveys, not to shipping, VAT or tax, reward upgrades, or the original campaign pledge.
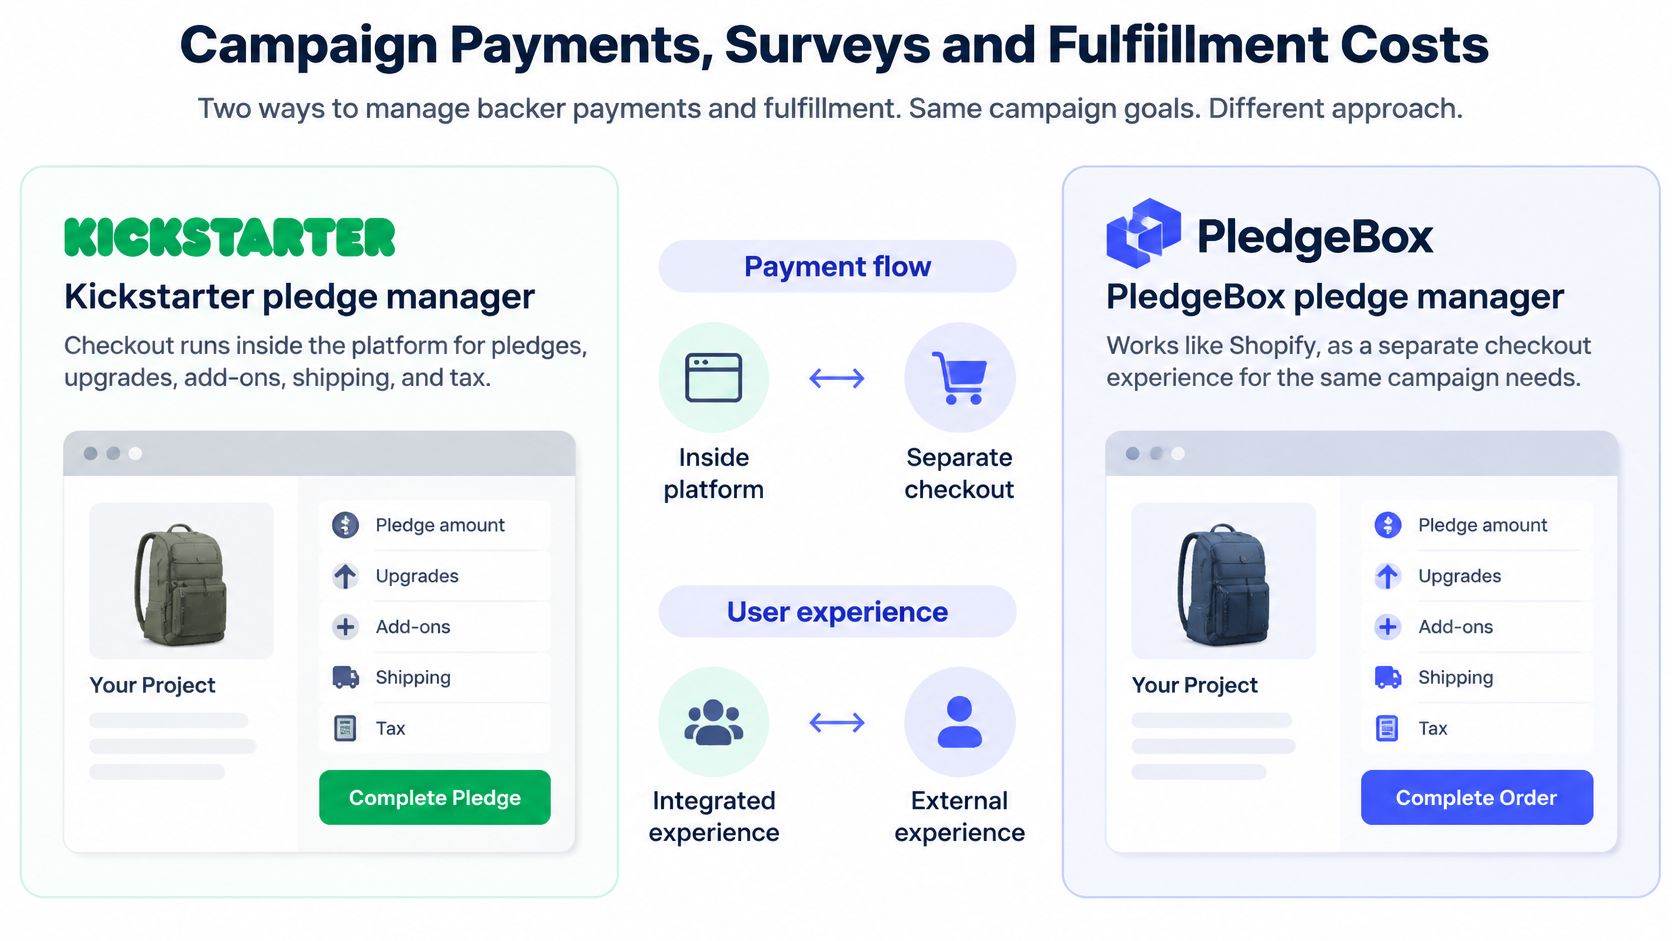
Budget the fee against add-on sales only. Shipping and tax collection, along with reward upgrades, do not add to the fee.
| Survey Scenario | Collected Through Survey | 3% Platform Fee |
|---|---|---|
| Addresses and product choices only | $0 | $0 |
| Shipping and tax only | $40 | $0 |
| Add-on upsell | $100 | $3 |
| Reward upgrades | Whatever the upgrade costs | $0 |
Before sending invitations, configure products, variants, reward mapping, shipping, tax and payment settings. Preview the backer experience and resolve blocking checklist messages. A mistaken variant mapping can leave backers with the wrong choices and create avoidable support work.
After surveys close, export intended orders from Download Center or use an available shipping integration to prepare them for fulfillment. Compare the expected add-on sales after the 3% fee with the staff time required to collect addresses and handle add-on orders manually. Include migration and training costs in that comparison: recurring licence savings can be outweighed by the one-time work of switching tools, especially when the fulfillment period is short.
Adding an AI tool wherever it promises automation is how stacks acquire a layer nobody audits. The harder question is control: which agents read supporter data, what they're allowed to change, and how a bad automated decision gets reversed.
The inventory gap is real. IBM reported in 2026 that only 18% of organizations maintained a current and complete AI inventory, while 68% of executives worried AI initiatives would fail because of insufficient integration, per IBM's Think 2026 recap. If you can't name the agents touching addresses, emails, payment-related information or tax data, you can't govern them.
Start with data scope. List what each tool holds, cut access down to what its job needs, and confirm records can be deleted when a campaign closes. Our data security practices for campaign tools cover the deletion and isolation questions worth asking a vendor before you connect it.
Build a short register: agent or integration, owner, data it reads, actions it can take. Restrict high-impact actions such as refunds, address changes and tax edits to human approval, log every automated decision, and test rollback before widening scope. Then track five measures: human-review rate, reversible-action coverage, data-retention limits, cost per completed workflow and incident escalation time.
Govern before you scale. Automation added without a register produces duplicate workflows and unclear responsibility, and both surface at the worst moment, which is mid-fulfillment.
A cutover can save recurring licence costs and still lose money if migration, reconciliation, and staff training consume the savings. Treat consolidation as a phase-based cost decision: keep the old workflow available until the replacement passes practical checks.
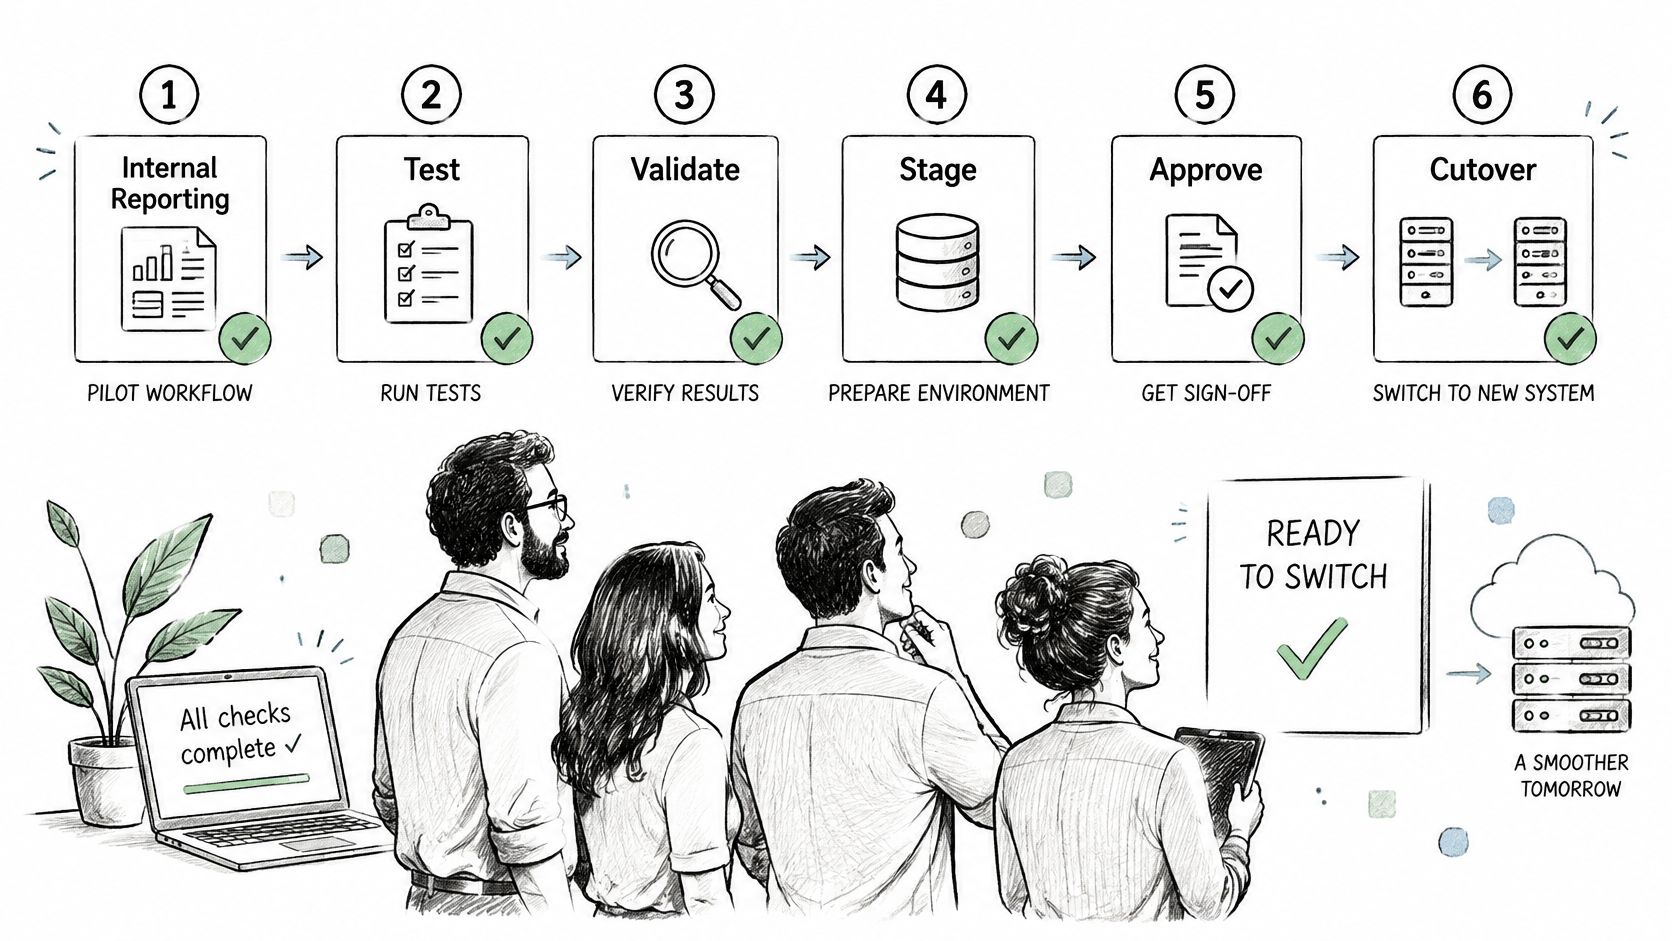
Go/no-go discipline: Assign an owner, date, and written pass condition to each phase. Without those, parallel testing is easy to shorten and rollback can remain untested.
Budget for the transition, not just the new subscription. Data mapping, staff training, parallel operation, and archive preparation all take time. A migration that saves licence fees but increases manual corrections or slows fulfillment may raise the campaign's total operating cost.
Choose one tool from the inventory, set its pilot date, and estimate the one-time migration and training effort alongside recurring savings. PledgeBox brings together pre-launch pages, email marketing, campaign management, pledge surveys, and fulfillment preparation for Kickstarter and Indiegogo campaigns. Its fee applies to extra money collected through the platform, such as add-ons, reward upgrades, shipping fees, or VAT, so there is no fee when there is no extra revenue. If you are consolidating before your next campaign, visit PledgeBox to review which tools its features could replace.
PledgeBox
The All-in-One Toolkit to Launch, Manage & Scale Your Kickstarter / Indiegogo Campaign