 PledgeBox
Marketing Analytics Report for Crowdfunding Campaigns
Build a marketing analytics report that tracks funnel metrics, attribution models and backer survey revenue, with formulas and a ready-to-use template.

Build a marketing analytics report that tracks funnel metrics, attribution models and backer survey revenue, with formulas and a ready-to-use template.
Integrated analytics could free approximately 15% to 20% of marketing spending, according to a McKinsey review of more than 400 client engagements across eight years, described in Novatio's review of marketing analytics. For a crowdfunding creator, that reframes the purpose of a marketing analytics report: it should help you decide where money goes next, not just document where it went.
A useful report connects pre-launch interest, live pledges, and post-campaign purchases. It separates revenue a channel receives credit for from revenue that wouldn't have happened without it.
A marketing analytics report combines campaign results with interpretation and a spending decision. Your dashboard might show that retargeting generated pledges. Your report should explain whether those backers were already likely to pledge, whether acquiring them was worthwhile, and what you'll change.
Say you're launching a tabletop game with an optional expansion. You need to understand both the original pledge and the later expansion purchase, without counting the same backer or payment twice.
Read the report in this order, starting with the campaign's outcome and ending with assigned actions.
| Report section | Question it answers | Data to pull | Crowdfunding example |
|---|---|---|---|
| Executive summary | Did the campaign reach its goal, and at what cost per pledge? | Total pledges, total ad spend, funding goal | Blended cost per pledge across all channels |
| Funnel performance | Where do visitors drop off before pledging? | Page visits, email signups, pledges | Visit-to-pledge rate by traffic source |
| Channel spend and return | Which paid channels return the most revenue per dollar? | Spend, clicks, attributed revenue by platform | Meta versus Google Ads return on ad spend |
| Attribution comparison | Do channel rankings change under a different model? | Conversions under at least two models | Email signup ranking under last-click versus linear |
| Incrementality check | Which conversions would have happened without the channel? | Holdout or matched-audience results | Retargeting pledges compared with a holdout group |
| Backer and survey outcomes | How many backers completed the survey and bought add-ons? | Survey completions, add-on orders, shipping fees collected | Add-on take rate among surveyed backers |
| Next-campaign actions | What will change in budget, creative and timing? | Findings from all sections above | Shift budget from the lowest-return channel to the strongest |
Keep the pre-launch, live campaign, and survey periods distinguishable. A pre-launch expense may generate a live pledge, while an expansion sale may happen after funding closes. Combining everything into an undated revenue total hides that sequence.
Use a consistent backer identifier to connect records where permitted. Reconcile payments against campaign and survey records, and keep merchandise revenue separate from shipping and tax collections.
Practical rule: Every finding should end with an action, an owner, or a reason to keep collecting evidence.
For help turning observations into decisions, Sprints & Sneakers explains how to build decision-driven marketing reports. Apply that discipline by writing a short interpretation beside each table rather than exporting charts without commentary.
Build the report weekly during the live campaign, then refresh it after the survey closes. Mark incomplete periods clearly so late payments don't look like sudden performance improvements.
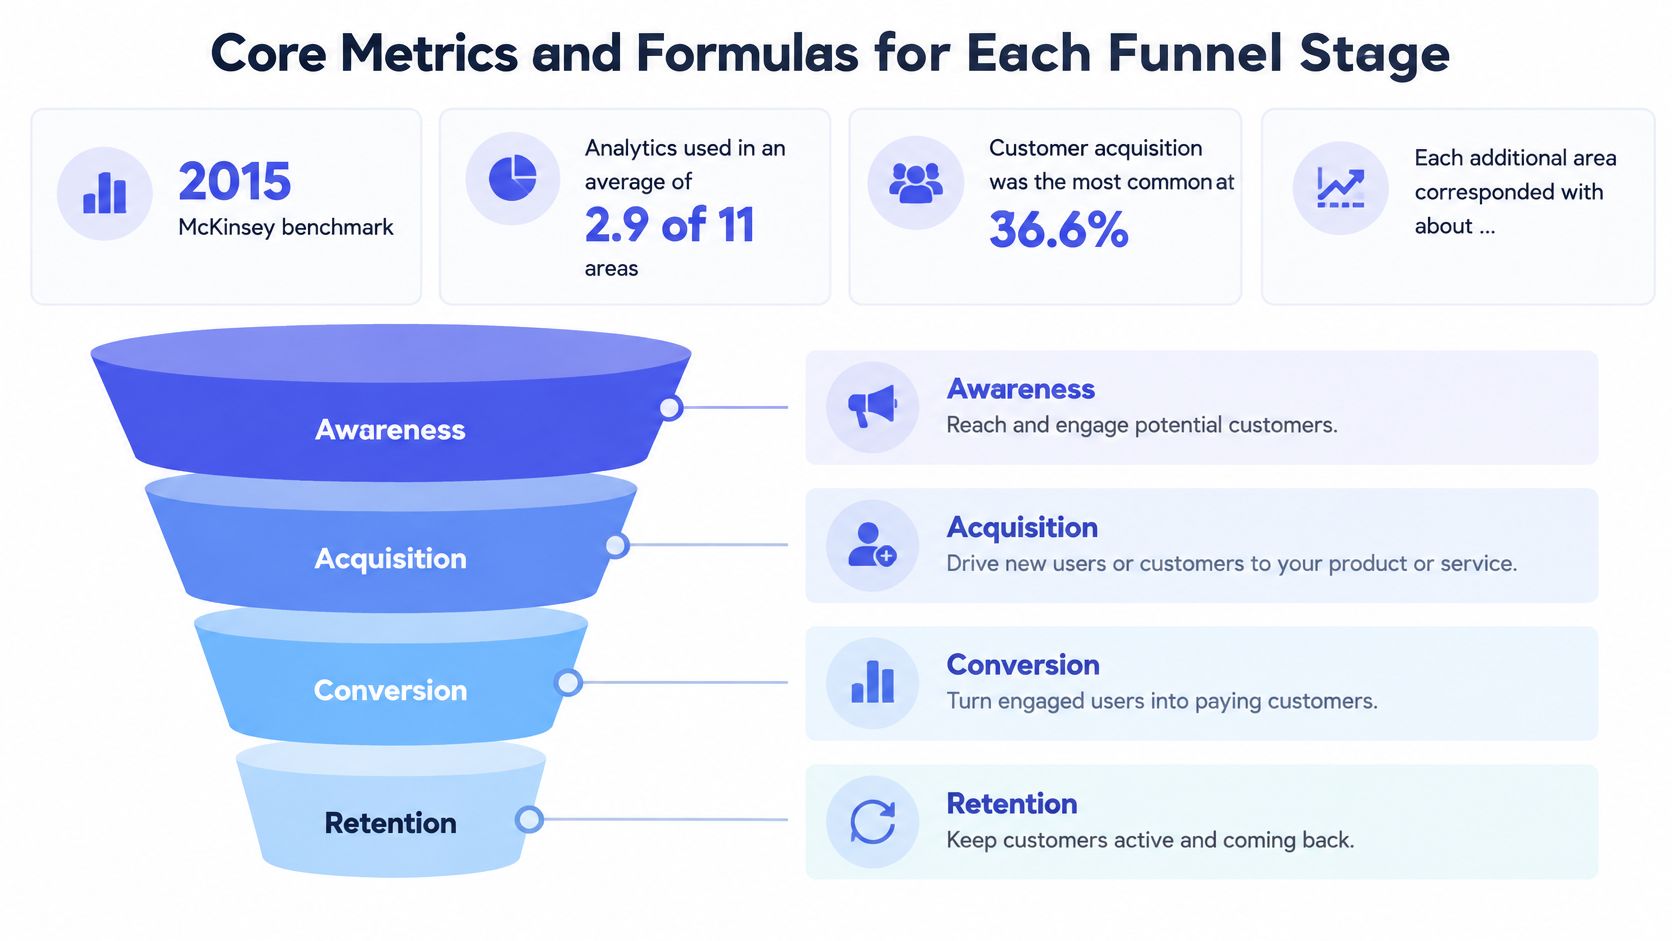
In a 2015 McKinsey analysis, companies used analytics in an average of 2.9 of 11 areas, customer acquisition was the most common application at 36.6%, and each additional area corresponded with approximately a 0.39% increase in profits. That was an association, not proof that analytics alone caused the improvement.
The practical lesson is breadth. Measuring cheap clicks without measuring pledges and post-campaign purchases leaves important decisions unsupported.
Use the funnel as an organizing aid, not as a substitute for your campaign's own results.
| Funnel stage | Metric | Formula | How to read it |
|---|---|---|---|
| Acquisition | Cost per click | Ad spend divided by clicks | Rising cost with flat clicks can suggest audience fatigue |
| Acquisition | Cost per email signup | Ad spend divided by new signups | Compare with pledge conversion to judge lead quality |
| Conversion | Visit-to-pledge rate | Pledges divided by campaign-page visits | High signups with low pledge conversion suggest an offer or page problem |
| Conversion | Average pledge value | Total pledge value divided by number of pledges | Shows whether reward mix or upgrades lift order size |
| Return | Return on ad spend | Attributed revenue divided by ad spend | Read alongside the attribution model used |
| Return | Customer acquisition cost | Total spend divided by new backers | Compare with pledge value and contribution margin |
| Post-campaign | Survey completion rate | Completed surveys divided by backers | Low completion can delay fulfillment and upsell collection |
| Post-campaign | Add-on attach rate | Backers who bought add-ons divided by surveyed backers | Tracks upsell success after pledges close |
Define the denominator before calculating. For surveyed backers, specify whether you mean invited backers or completed-survey respondents, then keep that definition unchanged. Count backers who bought add-ons, not the number of add-on items sold.
For the tabletop campaign, inexpensive signups might come from an ad emphasizing free downloadable content. If those subscribers rarely pledge, the signup cost alone doesn't establish lead quality.
A high signup rate with a low pledge rate usually calls for checking the offer, campaign page, and message continuity before buying more traffic. Confirm that subscribers received the launch announcement, too.
Return on ad spend, or ROAS, doesn't deduct manufacturing, fulfillment, payment costs, or refunds. Likewise, acquisition cost below average pledge value doesn't automatically mean a backer is profitable.
Record which expenses are included in total spend. If you include creative production in customer acquisition cost but exclude it from channel ROAS, label that distinction.
Never compare ROAS across reports that used different attribution models. Align the model, conversion window, and revenue definition first.
A retargeting ad closes a tabletop-game pledge and looks like the winner under last-click attribution. The pre-launch ad that introduced the game and captured the backer's email looks weak because it never received the final click.
The comparison below illustrates why the reporting rule matters.
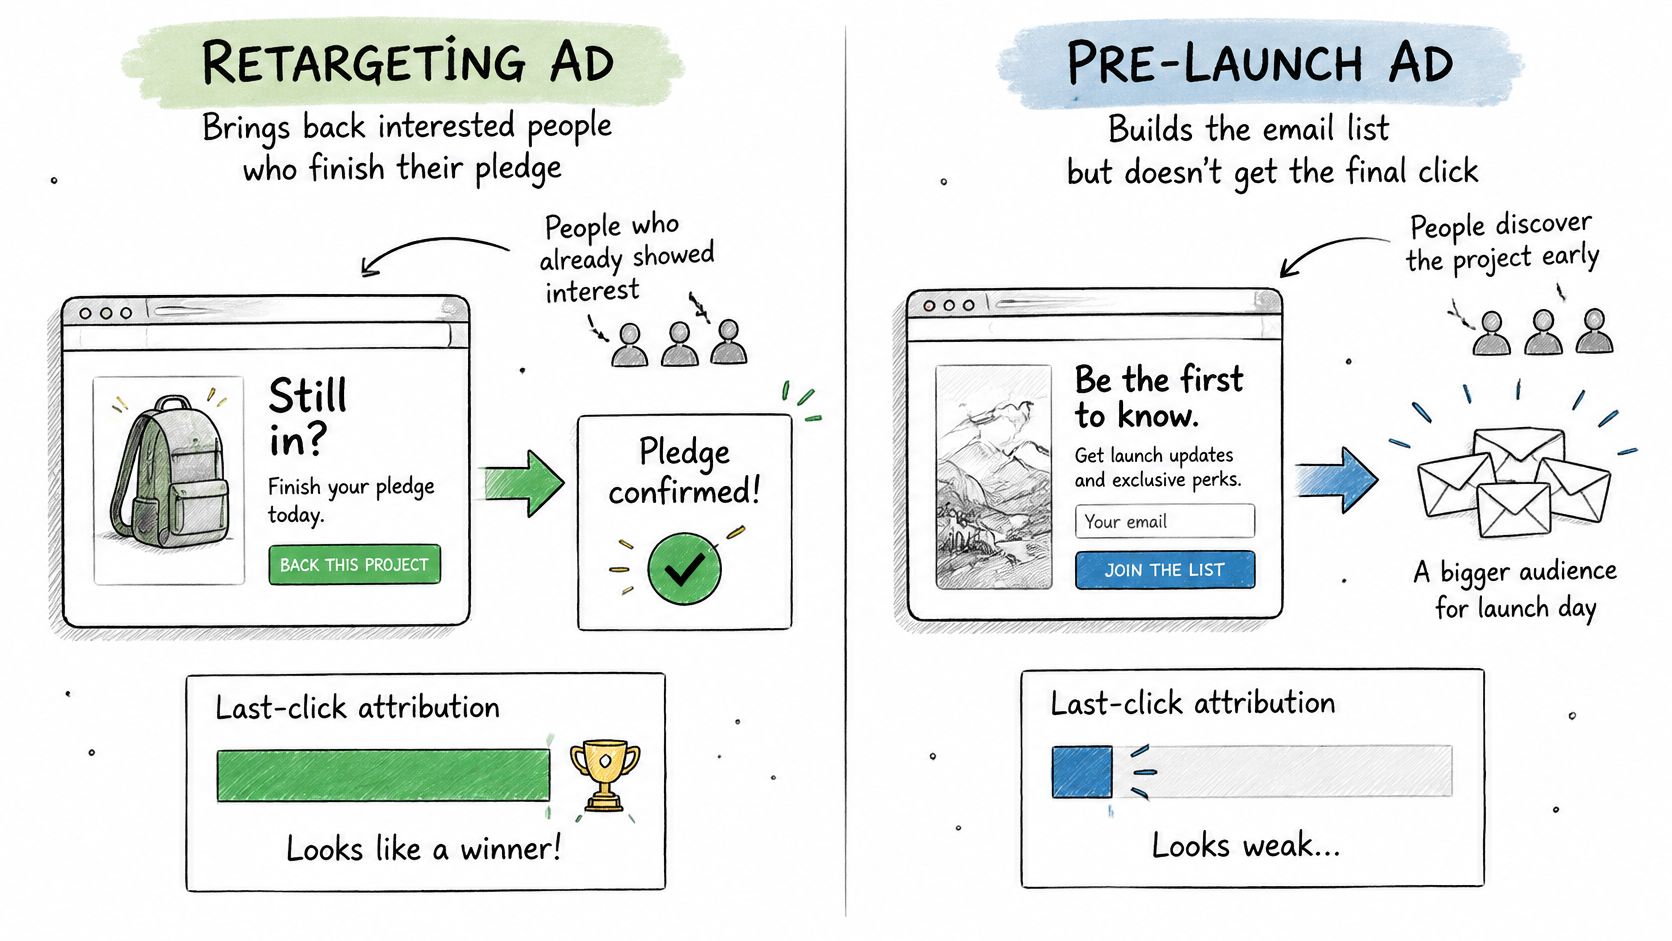
Attribution assigns credit; it doesn't automatically establish causality. Google's attribution documentation supports comparing model outputs to understand which channels gain or lose credit.
These models describe alternative allocation approaches, not a promise that every analytics platform currently offers every option.
| Model | How it assigns credit | Question it answers best | Main risk |
|---|---|---|---|
| Last-click | All value to the final interaction | Which channel closed the pledge? | Overrates closing channels such as retargeting |
| First-click | All value to the first interaction | Which channel started the journey? | Ignores later nurturing |
| Linear | Equal share to every interaction | Which channels appear along the journey? | Treats weak and strong touchpoints equally |
| Position-based | Emphasizes first and last interactions | Which channels start and close journeys? | Uses conventional rather than measured weights |
| Data-driven | Based on estimated changes in key-event probability | Which touchpoints contribute to outcomes? | Requires sufficient path data and conversions |
Data-driven attribution evaluates converting and non-converting journeys rather than applying fixed weights. Google's Search Ads 360 documentation describes using factors including elapsed time, device, interaction sequence, and creative type to estimate touchpoint contribution.
Define email signup, campaign-page visit, pledge, survey completion, add-on purchase, and late pledge separately. Otherwise, a channel generating inexpensive signups can appear successful while producing few paying backers.
For a broader explanation of cross-channel credit, Keywordme's guide can help you move beyond last-click attribution. Use consistent source labels, supported by a traffic-source analysis workflow, so campaign names remain recognizable across exports.
Use this video alongside your model comparison.
Report conversion value, cost, and ROAS under at least two models. Treat stable channel rankings as stronger evidence for prioritization, while investigating unstable rankings rather than declaring a winner. Neither model comparison nor algorithmic attribution replaces a controlled lift test.
Most reports explain channel performance without answering whether the credited purchases would have happened anyway. In Haus's 2025 growth-marketing study, 90% of surveyed consumer brands ranked incrementality testing among their two most trusted measurement methods.
For your game launch, retargeting may reach people who already read every creator update. You need an estimate of what those people would do without the ads.
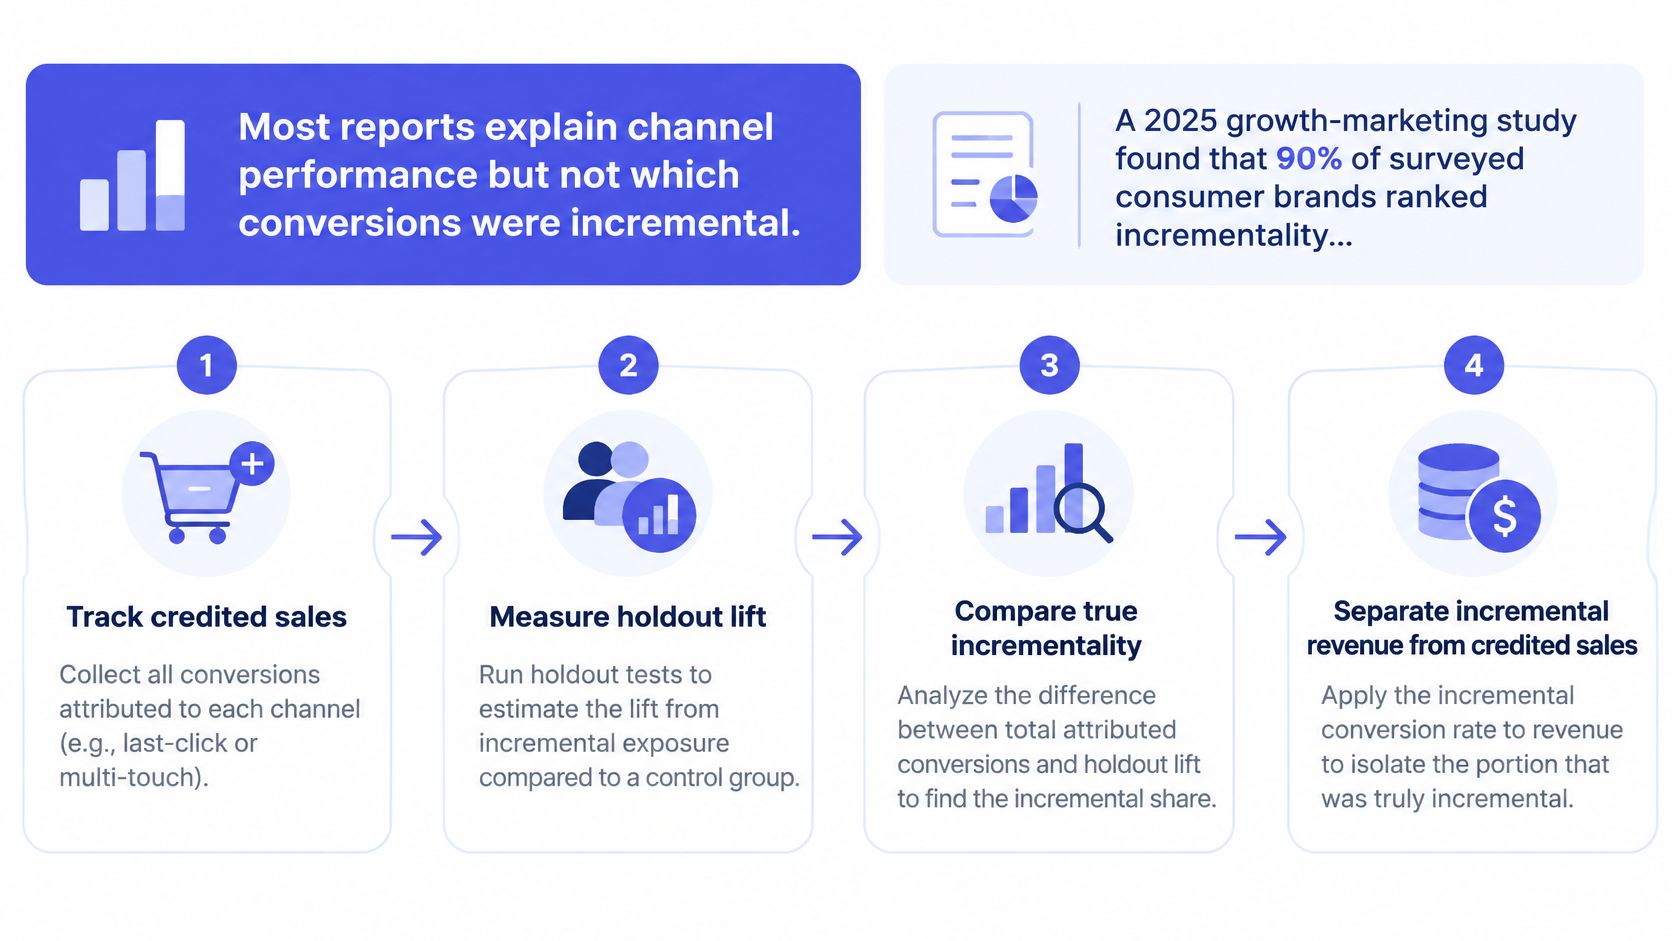
Choose a testable channel. Retargeting is a practical candidate when you can identify an eligible audience and suppress advertising to part of it. The common slip is choosing an audience too small to produce interpretable results.
Randomly assign eligible people to exposed and holdout groups. Keep the holdout excluded from that channel while allowing normal campaign communications in both groups. Watch for audience leakage through overlapping ad sets.
Use the full live window. Preserve the assignment throughout the test and define how you'll handle delayed pledges. Ending observation early can miss purchases that happen after someone considers the reward.
Compare pledge rates per thousand eligible people. Use eligible people as the denominator for both groups, not ad clickers in one and everyone in the other. Comparing raw pledge totals is misleading when group sizes differ.
Estimate incremental pledges. Multiply the difference in pledge rates by the exposed audience size, keeping units consistent. Don't multiply a per-thousand difference as though it were a per-person probability.
Compare lift with credited pledges. Record the platform's attributed result beside the experimental estimate, then assess uncertainty and contribution margin. A positive-looking difference based on sparse purchases isn't a reliable scaling signal.
A channel can receive credit for a real purchase without causing that purchase.
For implementation context, the guide to measuring ROI with Silver Spoon Agency connects test design with spending decisions. Keep your incremental-revenue calculation separate from attributed sales in the report.
Apply the same logic to an optional expansion promotion after the campaign. Both groups should retain access to ordinary survey and fulfillment services; vary the promotional exposure, not essential instructions.
If random holdouts aren't practical, consider geographic splits, matched audiences, or acquisition-cohort comparisons. These alternatives are more vulnerable to differences in timing and audience composition, so describe them as directional evidence rather than equivalent experiments.
Kickstarter Pledge Manager is like Amazon; PledgeBox Pledge Manager is like Shopify. The analogy describes the operating model: a platform-controlled checkout versus a separate commerce and survey layer, not identical features or ownership rights.
Kickstarter keeps reward selections, shipping, taxes, upgrades, and add-ons within its post-campaign pledge-manager flow. Its creator guidance states that there's no additional upfront cost, but usual Kickstarter fees are deducted from payments made through the tool.
PledgeBox's pricing makes it free to send the backer survey, with 3% charged only on add-on sales collected through surveys, if there are any. You can use the survey to collect addresses and product choices without offering extra products at all, in which case no percentage applies. There's no setup or campaign fee on original Kickstarter or Indiegogo funds.
| Feature | Kickstarter Pledge Manager | PledgeBox Pledge Manager |
|---|---|---|
| Model | Like Amazon, platform-controlled checkout | Like Shopify, separate commerce and survey layer |
| Upfront cost | No additional upfront cost | Free to send the backer survey |
| Fees | Usual Kickstarter fees deducted from tool payments | 3% fee on add-on sales collected through surveys |
| Original campaign funds | Collected inside Kickstarter's own flow | No setup or campaign fee on original Kickstarter or Indiegogo funds |
| Eligibility | Eligible Kickstarter campaigns with itemized rewards and no prior Backer Survey or other pledge manager | Supports Kickstarter and Indiegogo post-campaign workflows |
Kickstarter's eligibility rules also exclude campaigns already using another pledge-manager service. Check that operational constraint before sending surveys or committing to a workflow.
For the tabletop game, separate the original reward, expansion purchase, shipping charge, and tax collection in your reporting. A larger checkout total isn't necessarily a larger merchandise sale, and tax collected shouldn't become marketing revenue.
Whichever tool you use, verify that exported backer and order records can be joined to your acquisition records through an appropriate identifier. Preserve unmatched records as unknown rather than guessing their source.
An expansion attach rate without acquisition-source information can guide merchandising, but it can't tell you which advertising audience produced expansion buyers. The trade-off isn't integrated checkout versus a separate tool; it's also convenience versus the reporting workflow your team can maintain accurately.
In Supermetrics' marketing-data report, 66% of marketers worried about cross-channel tracking as third-party cookies decline, 57% expected attribution and measurement to become harder, and only 16% reported using zero-party data. That's information people intentionally provide, such as preferences and survey answers.
Meanwhile, Brandwatch reported that 69% of surveyed marketers used website and app analytics in 2025. Behavioral analytics and declared information serve different purposes, so label them rather than treating every field as equivalent.
Pre-launch, declared. Collect product interest and reward preferences through an opt-in signup. For the game campaign, distinguish interest in the base game from interest in the expansion.
Campaign, transactional. Take pledge amount and reward choice from the campaign record. These are recorded purchases, not answers to a preference questionnaire.
Post-campaign survey, declared. Collect the shipping address and chosen product variant for fulfillment. Restrict address access to people who need it.
Upsell, declared and transactional. Survey selections describe what the backer chose; payment records confirm what they purchased. Don't count an abandoned selection as an add-on sale.
Fulfillment, operational. Use shipment status and delivery issues to check whether expansion buyers received their items. Buying an add-on and successfully receiving it are different outcomes.
| Lifecycle stage | Data to collect | Source and consent | How the report uses it |
|---|---|---|---|
| Pre-launch | Product interest, reward preferences | Opt-in signup, declared | Segment email capture |
| Campaign | Pledge amount, reward choice | Campaign pledge record | Average pledge value by channel |
| Post-campaign survey | Address, product variant | Backer survey, declared | Fulfillment readiness, address errors |
| Upsell | Add-on and upgrade choices | Survey response, declared | Attach rate by traffic source |
| Fulfillment | Shipment status, delivery issues | Fulfillment record | Confirm delivery to upsell buyers |
Declared information is easier to explain than inferred preferences, but it isn't permission for unrestricted reuse. Apply purpose limits and access controls through a documented data-privacy and compliance process.
Keep declared preferences separate from behavioral tracking. Set a deletion or review date after fulfillment, retaining records required for legitimate legal or accounting obligations, and connect survey outcomes to acquisition channels only where permitted. Use aggregated source-level results in the marketing report rather than exposing addresses.
Move money only when a channel performs strongly under two attribution models and a holdout shows credible lift. That's a conservative scaling rule, not a reason to stop all exploratory spending when evidence is incomplete.
For the tabletop launch, paid search might look less impressive than retargeting on the ad-platform dashboard. If search produces more defensible incremental pledges, the creator should prioritize that evidence over the most flattering attributed total.
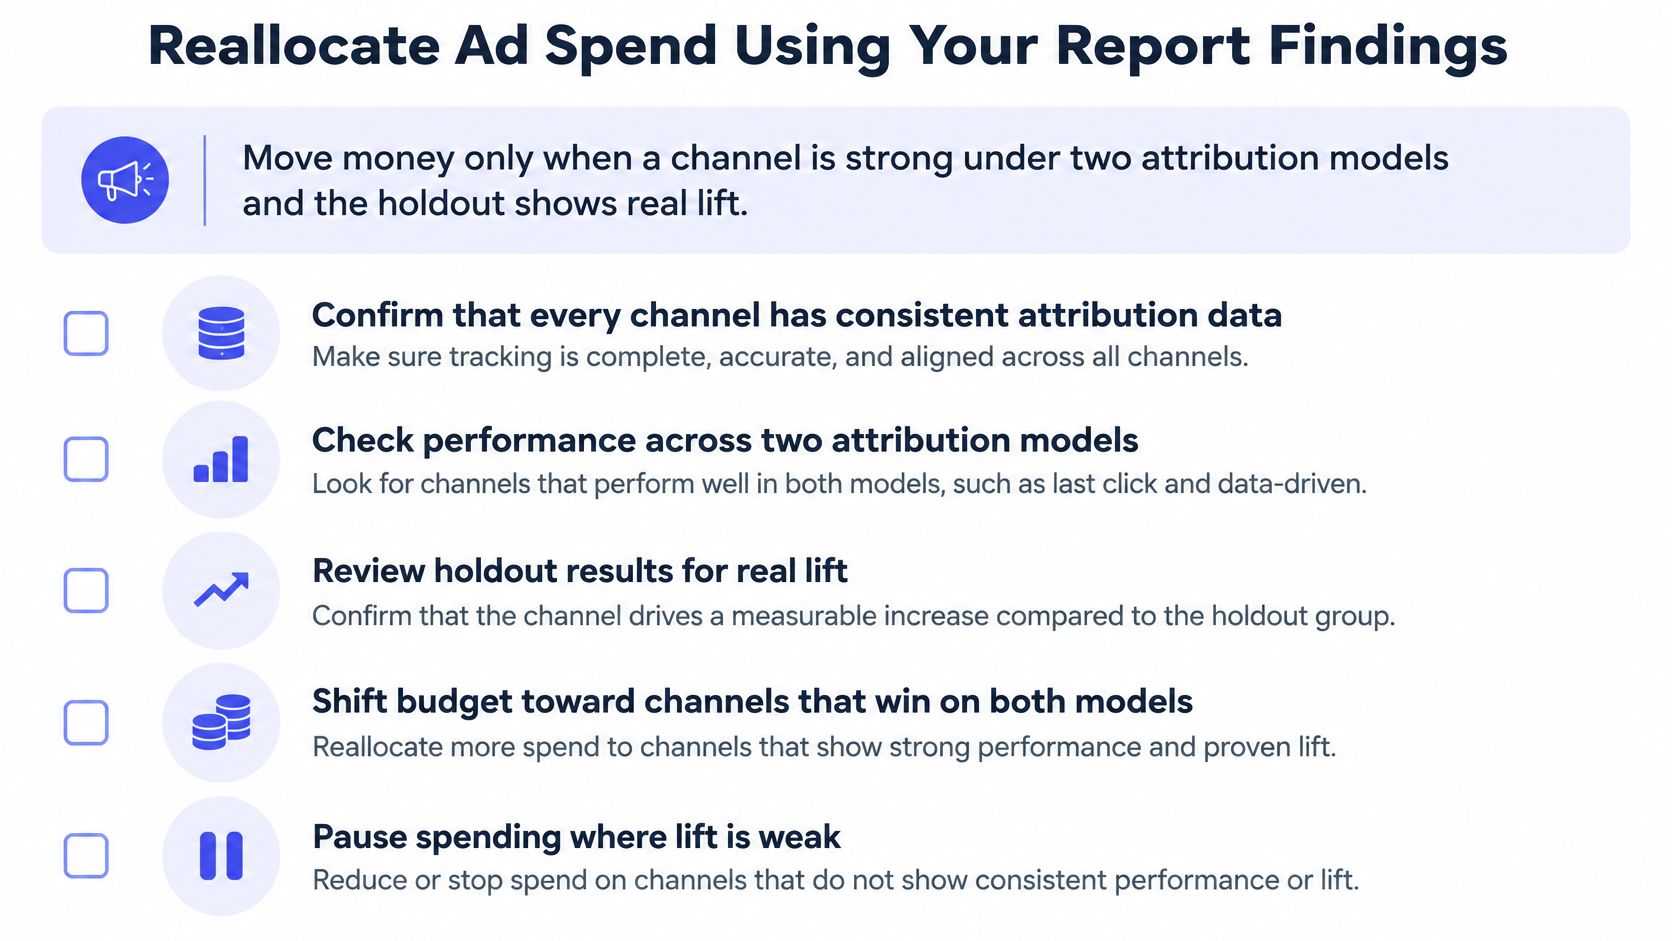
Standardize the comparison. Confirm matching date ranges, time zones, attribution models, and conversion windows. Our Campaign Manager shows campaign rank, traffic sources, pledge velocity, and backer trends on one dashboard, while our Pre-launch Kit integrates with Meta, Google Ads, and Mailchimp for campaign attribution. Use those inputs to investigate changes, not to assume every platform counts the same pledge identically.
Shift budget gradually. Reduce investment in the weakest ROAS channel and increase the allocation to a channel with stable, incremental pledges. Watch what happens to acquisition cost as spending rises, because the next audience may be less responsive than the original one.
Repair conversion leaks before expanding traffic. If interested subscribers reach the game page but don't pledge, inspect reward clarity, delivery expectations, demonstration content, and shipping explanations. Assign a specific page change rather than writing a vague instruction to improve conversion.
Test an optional survey offer. Present the expansion or a reward upgrade, then measure completed purchases by acquisition source. Our Pledge Manager manages backer surveys, upsells, shipping fees, and tax/VAT collection; keep those payment categories distinct when evaluating the offer's contribution.
Review late-stage pledges separately. Compare backers arriving near campaign close with launch-day backers. Deadline-driven interest, creator updates, and repeat visits may require different creative and timing, so don't apply the launch-day message automatically.
Budget safeguard: Write down the expected result before making a change, then compare the outcome with that expectation.
Keep a decision log containing the finding, proposed change, responsible person, and review point. If a change doesn't produce the expected result, you'll know what to reverse instead of making another adjustment without a clear basis.
PledgeBox is free to send the backer survey and only charges 3% of upsell payments if there are any, with the additional-payment scope described above. An optional add-on test therefore has no upfront survey-send charge, but don't confuse that with zero operating cost: production, fulfillment, and other survey-collected payments still matter.
PledgeBox connects pre-launch attribution, live campaign monitoring, and post-campaign survey operations so you can carry your marketing analytics report through to fulfillment. Visit PledgeBox to organize your campaign workflow, prepare a backer survey, and measure which acquisition sources produce completed pledges and add-on purchases.
PledgeBox
The All-in-One Toolkit to Launch, Manage & Scale Your Kickstarter / Indiegogo Campaign