 PledgeBox
10 Campaign Analytics Tools for Crowdfunding
Compare 10 campaign analytics tools for crowdfunding creators, including features, pricing, integrations, limitations, and best-fit use cases.

Compare 10 campaign analytics tools for crowdfunding creators, including features, pricing, integrations, limitations, and best-fit use cases.
Most advice about campaign analytics tools starts with the wrong question: “Which dashboard should every creator use?” Crowdfunding teams rarely need one universal dashboard. Pre-launch acquisition, live campaign momentum, paid-media attribution, backer behavior, and post-campaign upsells produce different evidence, and each stage calls for different decisions.
This comparison evaluates tools by platform fit, tracking depth, integrations, pricing model, setup burden, and practical decision value. The broader marketing analytics market was estimated at USD 6.2 billion in 2025 and is projected to reach USD 7.24 billion in 2026, a 16.7% CAGR, which reflects how heavily organizations are investing in measurement and reporting infrastructure, as documented in the marketing analytics market report.
PledgeBox belongs in the comparison because it connects crowdfunding acquisition, campaign monitoring, surveys, upsells, and fulfillment instead of treating analytics as a separate reporting layer. Its pledge manager is more like Shopify, giving creators control over a branded post-campaign selling experience. Kickstarter's pledge manager is more like Amazon, where the platform provides a standardized marketplace-style checkout environment. PledgeBox is free to send the backer survey and charges only 3% of upsell revenue if there's any, with payment gateway fees still applying, as explained on the PledgeBox pricing page.
PledgeBox is the strongest choice when your campaign analytics need to connect directly to crowdfunding operations. It combines pre-launch audience capture, live campaign reporting, email activity, backer surveys, upsells, and fulfillment in one workflow, so creators don't have to reconcile a campaign dashboard with a separate survey product and a separate shipping system.
The pre-launch tools help creators collect leads and monitor traffic and conversions before the campaign goes live. During the campaign, the platform provides campaign performance views that help teams follow traffic sources, campaign rank, and pledge velocity. That makes the data more actionable than a report that only tells you how many people visited a page. A creator can use the evidence to decide whether to adjust referral incentives, change urgency messaging, or shift attention toward a channel producing higher-quality traffic.
The campaign analytics guidance from PledgeBox is useful for framing the difference between reporting activity and measuring decisions. The practical advantage is that campaign data remains connected to the backer journey.
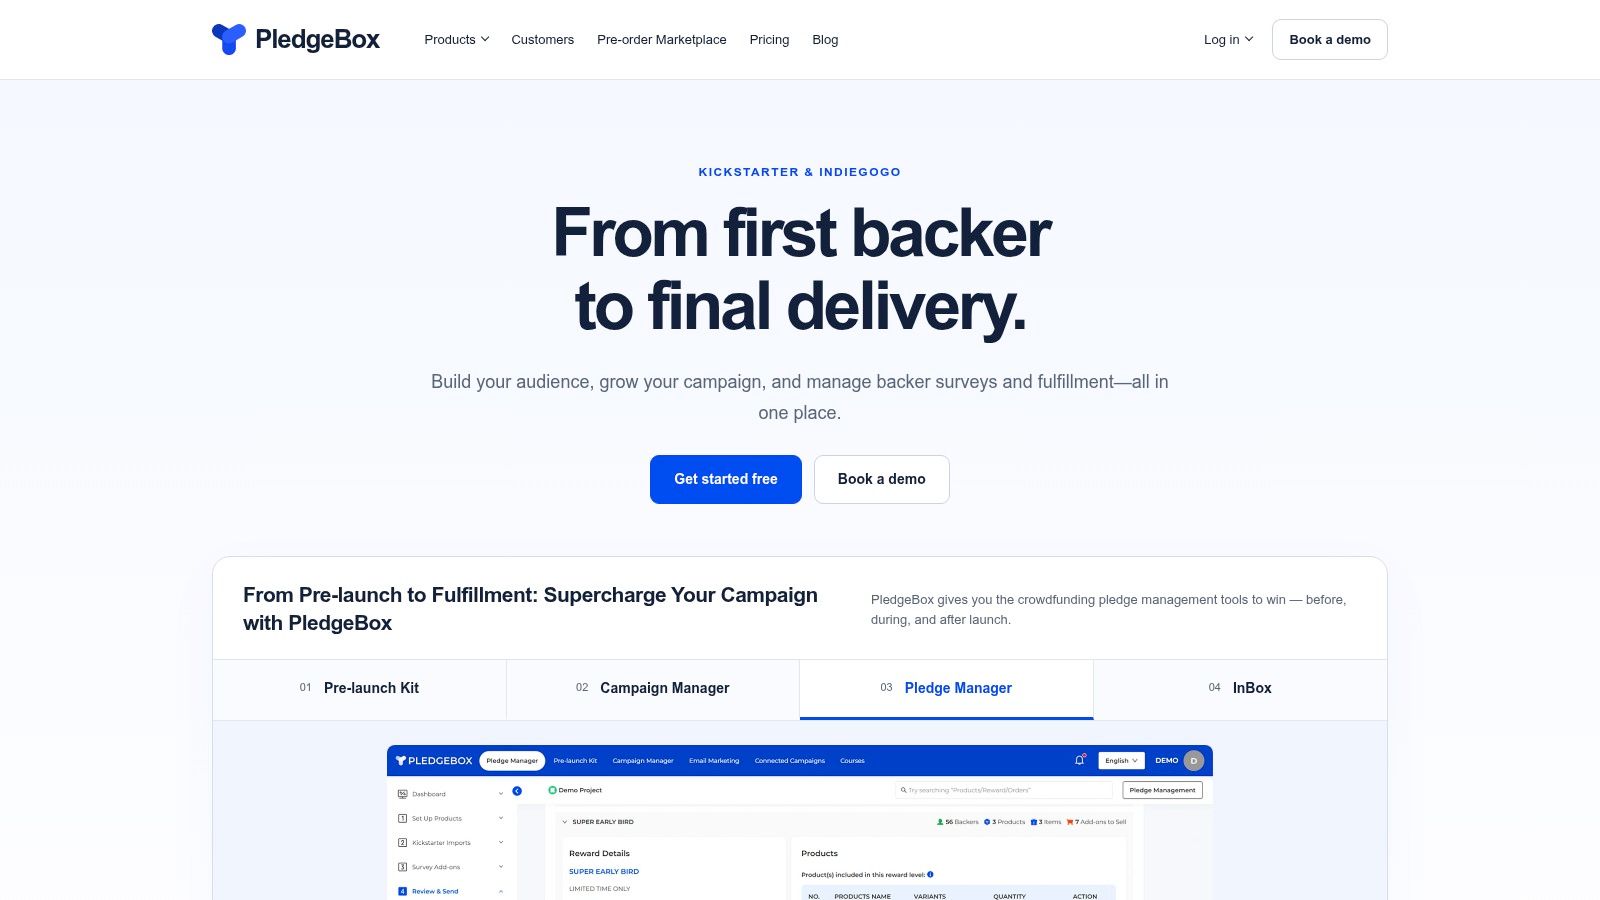
After funding, PledgeBox changes from an analytics tool into an operating system for post-campaign revenue and delivery. Creators can send branded backer surveys, collect add-on orders, calculate and collect shipping and tax, validate addresses, export vendor data, and connect shipping workflows. Stripe and PayPal are supported, and automatic shipment tracking helps teams keep fulfillment status visible.
PledgeBox also includes crowdfunding-focused email marketing through InBox, Backer Tester, newsletter amplification, and a pre-order marketplace. Those features matter because post-campaign performance isn't only about survey completion. It includes whether backers understand available add-ons, whether late buyers can still purchase, and whether the team can turn campaign attention into organized fulfillment.
Practical rule: Use PledgeBox when the cost of stitching together acquisition data, backer communications, upsells, and fulfillment is greater than the value of owning each function separately.
The main trade-off is gateway flexibility. PledgeBox supports Stripe and PayPal, so teams that require alternative payment rails may face constraints. The 3% platform fee applies to upsell revenue collected through paid surveys, and payment gateway fees still apply, so high-volume add-on programs should model total transaction costs rather than looking only at the platform fee.
PledgeBox is best suited to Kickstarter and Indiegogo creators, hardware teams, tabletop publishers, agencies, and anyone who wants a branded post-campaign store. Its defining distinction is simple: Kickstarter's pledge manager is like Amazon, while PledgeBox's pledge manager is like Shopify. One emphasizes a standardized platform experience. The other gives the creator more control over the selling environment and post-campaign relationship.
Google Analytics 4 is the broad web measurement layer most creators should consider before adding specialist tools. It tracks events across websites and apps, supports UTM-based campaign attribution, and can connect with paid channels. A creator can use it to understand where pre-launch visitors came from, which landing-page actions they took, and whether campaign traffic reached a defined conversion point.
For a pre-launch workflow, GA4 is useful for comparing newsletter, influencer, organic, and paid traffic when every link uses a consistent UTM structure. During the live campaign, it can help identify changes in traffic quality and landing-page behavior. After the campaign, it can support analysis of a branded store or post-campaign conversion path.
GA4 is free to start and widely documented, but its flexibility creates work. Someone must define events, mark meaningful conversions, establish naming conventions, and check that campaign parameters survive redirects to Kickstarter or Indiegogo. The PledgeBox guide to setting up conversions offers a useful reference for creators who need to turn campaign actions into measurable conversion points.
GA4 can export data to BigQuery for deeper analysis, and GA4 360 provides an enterprise tier with higher limits. Those options are valuable when a team has analysts or engineers who can maintain the data model. They won't solve attribution confusion automatically.
GA4 can show that a visitor arrived from a campaign link. It can't, by itself, make Meta, TikTok, Google, Kickstarter, and a post-campaign store use identical attribution rules.
The best use case is broad web measurement, not complete crowdfunding attribution. Choose GA4 when you need a flexible foundation across web properties. Pair it with a channel-native reporting tool for paid optimization and a crowdfunding-specific system for pledge, survey, and fulfillment decisions.
Kicktraq is built around the live Kickstarter campaign, where creators need to judge whether current funding activity supports the campaign's expected trajectory. It surfaces daily pledge and backer trends, funding projections, discovery pages, and historical campaign archives. The interface is easier to interpret than a general analytics system when the immediate question is, “Is momentum strengthening or weakening?”
A campaign manager can use Kicktraq during daily standups to compare current pledge velocity with the trajectory implied by recent performance. If momentum softens after a media mention, the team might investigate whether the traffic arrived but failed to convert. If the campaign is trending upward, the team can coordinate updates and outreach around that momentum rather than reacting to isolated hourly changes.
Kicktraq's forecasts are directional. They can help with expectation-setting and competitive research, but they don't explain which ad creative generated a pledge, whether an email segment converted, or whether a referral source produced valuable backers. Those questions require UTMs, channel reporting, and a conversion system.
The platform is also focused on Kickstarter. That focus is an advantage for creators who want a quick live-campaign readout, but it limits its value for an Indiegogo campaign or a multi-channel post-campaign store.
Use Kicktraq when the decision is about funding trajectory and public campaign momentum. Don't use it as a replacement for Meta Ads Manager, GA4, or a backer database. Its best role is a directional layer that helps a team decide whether to maintain, intensify, or rethink its live-campaign communications.
BackerKit BackerTracker gives creators a fast visual estimate of likely campaign outcomes for Kickstarter and Indiegogo. Its browser extensions overlay prediction graphs on campaign pages, while trending pages and project search support discovery and competitive research.
That makes it useful when a creator wants a quick external perspective without building an event schema or connecting APIs. A team reviewing similar campaigns can compare performance curves and use those patterns to set internal expectations. It can also serve as a lightweight reference during a live campaign when the team needs a visual signal rather than a detailed reporting workspace.
BackerTracker's models depend on historical patterns and comparable campaign behavior. A forecast can indicate where a campaign might finish if its current curve continues, but it won't identify the reason for a conversion decline. It doesn't provide channel-level return on ad spend, creative breakdowns, email attribution, or on-site behavioral analysis.
That limitation matters during a difficult launch. If pledges slow, the useful question isn't only whether the final projection has changed. The team also needs to know whether paid traffic is becoming more expensive, whether visitors are abandoning the reward selection, or whether a campaign update is failing to reach existing followers.
Choose BackerTracker for fast forecasting and competitive context. It works alongside a creator dashboard, not instead of one. For a campaign that depends heavily on paid acquisition, treat its estimate as a planning input and use the relevant ad platform and web analytics system for optimization decisions.
Mixpanel is a strong choice when the important question is what visitors and backers do at each step of a journey. It supports event-level analysis, funnels, cohorts, behavioral segmentation, retention analysis, experiments, and self-serve exploration.
For crowdfunding, that can mean tracking a pre-launch signup, an email click, a reward-page visit, an add-on selection, or a checkout attempt. A creator can compare cohorts by acquisition source and examine whether people who joined through an influencer link behave differently from people who arrived through paid social. The same model can be applied to post-campaign upsells and late-backer flows.
Mixpanel requires event planning and instrumentation. Before implementation, define the actions that matter, such as prelaunch_signup, reward_viewed, checkout_started, and upsell_added. The names themselves aren't important. Consistency is. If each campaign uses different event definitions, later comparisons become unreliable.
The platform's flexibility also means usage can grow with event volume. A traffic surge can create more analytical value, but it can also increase usage-based costs and expose poorly governed tracking. Teams should decide who owns the event schema and who reviews redundant or noisy events.
Mixpanel is best for behavioral conversion analysis and cohort decisions. It won't replace Kickstarter's campaign ledger, a paid-channel reporting system, or a fulfillment platform. Use it when a creator has enough control over the website, landing pages, or post-campaign store to instrument meaningful user actions.
Amplitude focuses on user journeys, funnels, cohorts, retention, and behavioral segmentation. It suits hardware, game, and software-adjacent crowdfunding teams that want to understand how visitors move from a campaign message to a reservation, signup, purchase, or add-on decision.
A creator might use Amplitude to compare landing-page journeys triggered by different email messages. Another team could examine whether people who interact with a product demonstration return to the campaign page or proceed to a reward selection. For a post-campaign store, journey analysis can reveal whether buyers who view a bundle are more likely to complete checkout than visitors who see a single product.
Amplitude's strength is the self-serve analytics culture around journeys and funnels. Documentation and integrations help teams build a repeatable measurement practice rather than relying on one-off reports. Eligible startups may also have access to a startup program with first-year allowances, subject to the program's conditions.
The trade-off is implementation effort. Like Mixpanel, Amplitude needs a clear event model, tracking ownership, and data governance. Higher tiers can be sales-led and less transparent to teams trying to forecast costs early, so a creator should confirm limits and required capabilities before committing.
Use Amplitude when the campaign team expects to analyze multiple journeys over time, not just review launch-day traffic. It's a good fit for organizations with product or growth analysts. Smaller creator teams may find a simpler crowdfunding platform or GA4 setup more practical unless post-campaign behavior is a major growth channel.
Choose Amplitude for a durable behavioral measurement practice, not because another dashboard looks impressive during launch week.
Heap automatically captures user interactions such as clicks, page views, form changes, and other actions. That reduces the risk of discovering a funnel question after launch and realizing the relevant event was never tagged. Heap can also support retroactive event definition, which is valuable when a creator needs to investigate earlier signup or checkout behavior.
This makes Heap particularly useful for a small team moving quickly. A pre-launch page may change repeatedly as the team tests positioning, and a post-campaign checkout may include interaction patterns nobody anticipated. Autocapture gives the team more raw behavioral evidence without requiring every event to be specified in advance.
Autocapture isn't automatically clean data. Without naming rules and filters, the system can fill with low-value interactions that make analysis harder. Teams should define which actions deserve reporting status, separate meaningful conversion events from incidental clicks, and control access to session or journey data.
Heap can expose hidden drop-offs in signup and checkout flows. Journey maps and session replay may be available through add-ons, and warehouse syncs can connect the data to downstream analysis. Pricing is tiered, and add-ons or deeper retroactive analysis can increase cost, so the implementation plan should include both data governance and budget review.
Heap is best for rapid behavioral discovery when the team didn't plan every event upfront. It won't provide Kickstarter forecasting or paid-channel optimization. Pair it with GA4 or native ad reporting when you need acquisition context, and use it as the behavioral layer that explains what happened after a visitor clicked.
Meta Ads Manager and Events Manager are essential when Facebook and Instagram ads drive pre-launch traffic or campaign visits. Meta Ads Manager provides delivery, spend, audience, and conversion reporting, while Events Manager helps teams inspect Pixel and Conversions API health, match quality, and event diagnostics.
For acquisition, Meta's native reporting is the closest thing to a channel-level source of truth. A creator can compare ad sets, creatives, audiences, and campaign objectives inside the system where delivery occurs. During the live campaign, the team can monitor whether a conversion event is being received and whether tracking problems are distorting optimization.
Meta's numbers won't necessarily match Kickstarter's internal dashboard or GA4. Each system uses its own attribution rules, conversion windows, identity signals, and reporting logic. That isn't a reason to discard one system. It is a reason to define what each system is responsible for.
Use Meta for paid Meta optimization. Use Kickstarter or Indiegogo for recorded pledges. Use GA4 or another web analytics platform for broader site behavior. Use consistent UTMs to connect the views without pretending they measure the same thing.
Conversions API can improve tracking reliability compared with a browser-only Pixel, but a thorough implementation may require developer support or Google Tag Manager work. Teams should also check event deduplication so browser and server events aren't counted as separate actions. This is a technical setup decision, not a dashboard preference.
The biggest mistake is using Meta's reported conversions as the final answer for cross-channel incrementality. Platform-native analytics show what happens inside one channel, and privacy and device-tracking gaps limit multi-touch attribution. Use the data to optimize Meta delivery, then reconcile it with campaign and revenue outcomes.
Supermetrics is a connector and ETL layer for teams that need to move data from advertising and analytics platforms into a reporting destination. It can connect sources such as Meta, Google Ads, TikTok, and GA4 with Looker Studio, Google Sheets, BigQuery, and other destinations.
That makes it useful for an agency or campaign team that has outgrown manual spreadsheet exports. Instead of downloading channel reports and rebuilding the same formulas each week, the team can centralize recurring data flows and create a common reporting structure. The practical decision is not whether Supermetrics is a dashboard. It isn't. The decision is whether the team needs a dependable data pipeline feeding the dashboard it already uses.
Supermetrics speeds up multi-channel reporting without requiring every team to build custom API integrations. Its plan structure depends on factors such as destinations, data sources, users, and accounts, so costs can rise as the reporting operation expands.
The connector also doesn't decide how to define revenue, assisted conversion, or campaign success. Analysts still need to harmonize naming, currencies, dates, spend, and conversion logic. If Meta and Google report conversions under different attribution windows, placing both numbers in one chart doesn't create a fair comparison.
Use Supermetrics when the main pain is data collection and repeatable cross-channel reporting. The PledgeBox guide to campaign performance reporting is a useful companion for deciding which campaign outcomes belong in a recurring report. Choose another layer for behavioral analysis, forecasting, and backer fulfillment.
Databox is designed for dashboarding and stakeholder reporting. It brings together data from advertising, GA4, email, CRM, ecommerce, and product analytics tools through native integrations, then presents the results in templates, scorecards, scheduled reports, and blended metrics.
For crowdfunding agencies, the main advantage is speed. A client can receive a live view of spend, traffic, email performance, and campaign outcomes without the agency building a custom business intelligence environment from scratch. White-label options and multi-client management also make the platform relevant to consultants managing several campaigns.
A campaign dashboard should answer decisions, not display every available metric. Databox works well when the owner wants a concise view of acquisition cost, traffic quality, conversion activity, and revenue signals. It can also connect with tools such as Mixpanel and Amplitude, allowing a stakeholder report to include behavioral evidence alongside channel performance.
Databox is less flexible than a full BI environment such as Looker or Power BI when the team needs complex modeling, custom attribution, or warehouse-level transformations. Pricing scales with sources and dashboards, so a multi-client operation should map its reporting architecture before adding every available integration.
Databox also depends on the quality of the underlying systems. A polished dashboard can make inconsistent UTMs, duplicate conversions, or mismatched attribution windows look authoritative. Assign an owner to definitions and data checks before distributing the report.
Choose Databox for clear executive, client, and agency reporting. It isn't the best standalone answer for live campaign forecasting, detailed user journeys, or post-campaign fulfillment. Its value comes from making trusted data easy for other people to understand and act on.
| Tool | Core features | UX / Quality (★) | Value / Pricing (💰) | Target audience (👥) | Unique selling points (✨) |
|---|---|---|---|---|---|
| PledgeBox 🏆 | Pre-launch builder, pledge manager, branded surveys, email marketing, fulfillment integrations | ★★★★★ | 💰 Free to use; 3% on paid survey add-ons (Stripe/PayPal fees apply) | 👥 Kickstarter/Indiegogo creators, hardware & tabletop teams, agencies | ✨ AI setup wizard, tax/VAT auto-calc, Google Maps address validation, Backer Tester & pre-order marketplace |
| Google Analytics 4 (GA4) | Event-based web/app analytics, cross-device, BigQuery export | ★★★★ | 💰 Free (GA4 360 for enterprise) | 👥 Creators tracking traffic/source attribution & funnels | ✨ BigQuery export + ubiquity for UTM attribution |
| Kicktraq | Daily pledge/backer charts, funding forecasts, discovery/trending | ★★★ | 💰 Mostly free | 👥 Live Kickstarter creators for benchmarking & forecasting | ✨ Kickstarter-focused trend & archive insights |
| BackerKit BackerTracker | On-page prediction graphs (extension), trending search, historical comparisons | ★★★ | 💰 Free tool (extension) | 👥 Creators & observers wanting quick outcome estimates | ✨ In-browser overlay forecasts tied to historical curves |
| Mixpanel | Funnels, cohorts, retention, behavioral segmentation, experiments | ★★★★ | 💰 Free tier; usage-based pricing | 👥 Growth teams optimizing conversion flows & LTV | ✨ Flexible event-level exploration and cohort analysis |
| Amplitude | Journeys, funnels, cohorts, retention, startup program | ★★★★ | 💰 Free tier + paid tiers (enterprise pricing) | 👥 Teams focused on retention, product optimization | ✨ Mature governance, robust self-serve analytics culture |
| Heap | Autocapture of interactions, retroactive event definition, session replays | ★★★★ | 💰 Tiered pricing; add-ons may increase cost | 👥 Teams wanting fast insights without upfront instrumentation | ✨ Autocapture + retroactive event modeling |
| Meta Ads Manager + Events Manager | Ad delivery & conversion reporting; Pixel + Conversions API diagnostics | ★★★★ | 💰 Free tools; costs tied to ad spend & setup | 👥 Paid advertisers on Facebook/Instagram | ✨ CAPI/server-side tracking for improved match & reduced loss |
| Supermetrics | 100+ connectors to BI/Sheets/BigQuery; ETL for cross-channel dashboards | ★★★★ | 💰 Paid per destination/source; scales with use | 👥 Agencies, analysts building multi-channel reports | ✨ Fast connector-based ETL without custom APIs |
| Databox | Prebuilt dashboard templates, blended metrics, scheduled reports, white-label | ★★★ | 💰 Paid plans by sources/dashboards | 👥 Agencies, execs needing client-facing dashboards | ✨ Quick deployment of cross-channel dashboards and templates |
The best campaign analytics stack isn't the one with the most integrations. It's the smallest combination of tools that answers the decisions your team must make at each stage.
For an integrated Kickstarter or Indiegogo workflow, choose PledgeBox. It connects pre-launch pages, audience capture, campaign analytics, email activity, backer surveys, upsells, and fulfillment. That makes it particularly useful for hardware teams, tabletop publishers, agencies, and creators who don't want to operate a separate tool for every part of the campaign lifecycle. Its post-campaign model also deserves careful attention. Kickstarter's pledge manager is more like Amazon, a standardized marketplace experience. PledgeBox's pledge manager is more like Shopify, a branded selling environment that gives the creator greater control over products, add-ons, and the customer relationship.
For broad web measurement, choose GA4. It gives creators a flexible event-based foundation for pre-launch pages, campaign links, landing pages, and post-campaign stores. It works best when the team has defined UTMs and conversion events before traffic arrives. GA4 can tell you where visitors came from and what they did on a site, but it won't remove the need to reconcile platform-native ad reporting with Kickstarter or Indiegogo outcomes.
For paid-channel optimization, use the native tools. Meta Ads Manager and Events Manager are the right choices for Facebook and Instagram campaigns because they expose delivery, creative, audience, event, and tracking diagnostics in the ad environment itself. Don't mistake that channel authority for universal attribution. Meta's reported conversions, GA4 conversions, and platform pledges answer related but different questions.
For directional campaign forecasting, Kicktraq and BackerKit BackerTracker are practical choices. They help creators interpret funding curves and compare campaign momentum, but they don't explain why a visitor failed to pledge or which ad produced a profitable backer. Keep a web, behavioral, or ad analytics layer beside them.
For deeper behavior analysis, choose Mixpanel, Amplitude, or Heap. Mixpanel and Amplitude reward teams that can define and maintain an event schema. Heap reduces the initial burden through autocapture and retroactive analysis, but it still needs governance. These tools are most useful when the team is optimizing signup flows, reward selection, checkout, subscriptions, or post-campaign add-ons.
For consolidated reporting, choose Supermetrics or Databox. Supermetrics is the better fit when the core problem is extracting and transforming data from multiple sources. Databox is the better fit when stakeholders need accessible dashboards and scheduled reports. Neither tool can repair inconsistent source data or create valid attribution rules automatically.
Before adding anything, define the measurement foundation:
The pricing decision should be equally practical. PledgeBox is free to send the backer survey and charges only 3% of upsell revenue when there is any, while payment gateway fees still apply. Creators should separately account for the setup effort, usage charges, connector costs, dashboard costs, and technical maintenance associated with external analytics tools. A free tool can still be expensive if nobody knows how to configure or interpret it.
Start with the workflow, not the dashboard. If you need one connected crowdfunding system, begin with PledgeBox. Add GA4 for broad web measurement, native ad reporting for paid optimization, a behavioral platform when funnel questions become important, and Supermetrics or Databox when recurring stakeholder reporting justifies another layer. That approach keeps the stack understandable and gives every tool a clear job.
PledgeBox combines pre-launch audience capture, campaign analytics, email marketing, branded backer surveys, upsells, and fulfillment in one crowdfunding-focused workflow. If you want to reduce tool sprawl while giving Kickstarter or Indiegogo backers a more controlled post-campaign buying experience, visit PledgeBox and evaluate the platform for your next campaign.
PledgeBox
The All-in-One Toolkit to Launch, Manage & Scale Your Kickstarter / Indiegogo Campaign