 PledgeBox
What Is Customer Retention Rate? a 2026 Guide
What is customer retention rate? Learn how to calculate it, benchmarks that matter, and proven ways to improve backer loyalty for crowdfunding campaigns.
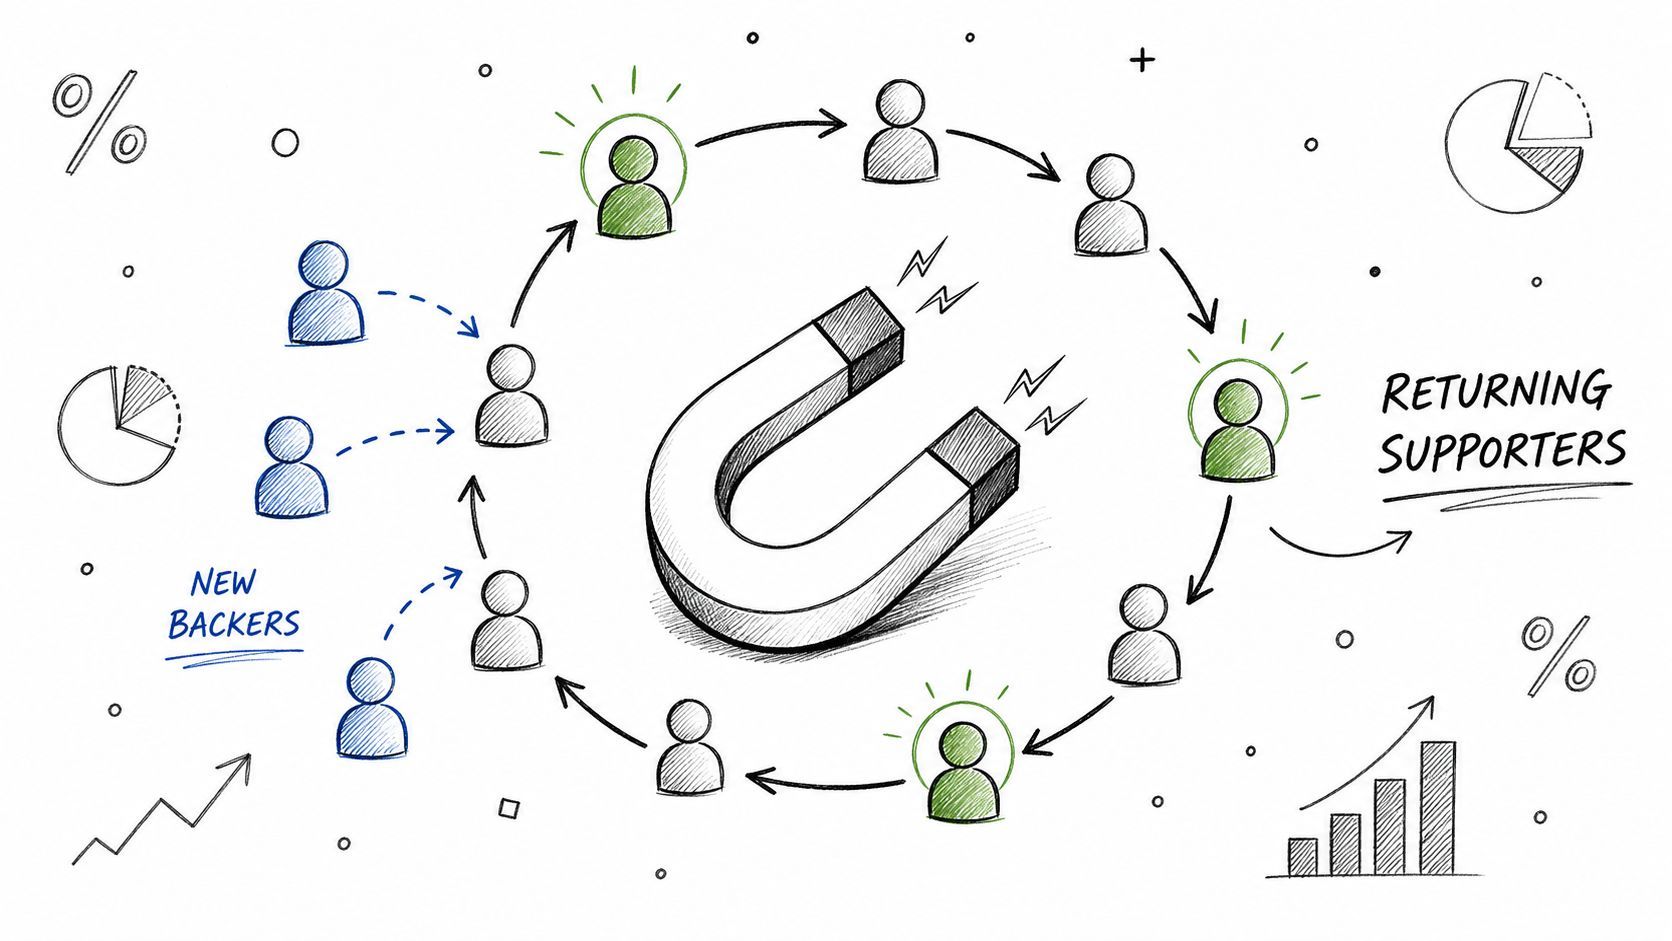
What is customer retention rate? Learn how to calculate it, benchmarks that matter, and proven ways to improve backer loyalty for crowdfunding campaigns.
Customer retention rate is 84% in insurance, 75% in banking, 63% in retail, 55% in hospitality, and 35% in SaaS in one 2026 roundup, but the answer is simpler. Customer retention rate is the percentage of existing customers who stay with you over a defined period.
If you've just closed a campaign and are staring at a backer survey spreadsheet, the number you want is whether the same people keep coming back, finishing their surveys, and buying again when the next launch opens. That's where the simple formula helps, but crowdfunding needs a more careful read than most generic retention guides give it. A backer doesn't behave like a subscription account, and a creator doesn't always need the same metric a SaaS team uses.
A creator finishes fulfillment, sends a backer survey, and waits to see who completes it. Some backers confirm shipping right away, some add extras, and a few show up again on the next campaign with the same trust and the same wallet. That return is the practical meaning of retention in crowdfunding, not just a dashboard number.
In plain terms, retention asks a simple question, did the people who already chose you choose you again? For a first-time creator, that might mean repeat backers. For a small brand, it could mean survey completions that lead to add-ons. For a larger campaign, it might be creator renewals across launch cycles. The number matters because it shows whether your relationship survives the first transaction.
A useful way to think about it is like keeping a customer list warm instead of letting it go cold. A backer who fills out a survey is still engaged. A backer who buys an extra part, upgrade, or accessory is even more engaged. If you want to explore a tactile way to keep your packaging and rewards more memorable, you can also design your own decals from Oracal vinyl as part of the post-campaign experience.
Practical rule: if a backer only appears once, you don't yet have retention, you have a single sale.
That's why this metric is less about polished reporting and more about repeat choice. It tells you whether your campaign created a relationship, or just a one-off transaction.

Customer retention rate is the percentage of existing customers who remain customers over a given period, and the standard formula is ((end-period customers – new customers) ÷ start-period customers) × 100. Salesforce uses that exact structure to define the metric, and Zendesk shows the same time-bound logic with a simple example of customers at the start, customers lost, and the result at the end of the period. Salesforce's retention rate definition is the cleanest starting point.
Think of the three parts like this.
That subtraction matters because it keeps the metric honest. If you don't remove new customers, you can make retention look better than it really is.
Here's a simple crowdfunding example. Say you start a post-campaign window with 1,000 backers, you add 250 new backers through late pledges, and you end with 1,050 backers who completed their backer survey and confirmed shipping. Plugging that into the standard formula gives ((1,050 - 250) ÷ 1,000) × 100 = 80%. That doesn't mean 1,050 people stayed. It means 800 of the original 1,000 stayed through the period.
Use the formula to isolate the original group. Otherwise, your new demand can hide churn in the people who mattered most at the start.
A survey walkthrough helps because it ties the math to real operations. If backers complete the survey, you know they're still in the process. If they upgrade their order, you've got a stronger signal than simple presence. For a creator who wants a field-tested post-campaign process, this backer survey guide is a useful companion to the formula itself.

A steady retention rate can hide a lot. You might keep fewer backers overall and still make more money from the ones who remain if they buy add-ons, late pledges, shipping upgrades, or post-campaign extras. That's why customer retention and revenue retention are related, but not the same decision tool.
Customer retention counts people. Revenue retention counts money. Net retention goes a step further and asks whether expansion from the customers you kept offsets what you lost. That distinction matters in crowdfunding because a backer who adds a premium accessory can be more valuable than three quiet backers who only bought once.
If you're comparing metrics, the safest rule is to match the number to the question. If you're asking, “Are people returning?”, use customer retention. If you're asking, “Are returning people spending more?”, use revenue-focused retention. The same backer pool can tell both stories, but not in the same way.
For creators, the simple retention headline can mislead. A campaign can look flat on customer count while the average order value inside the retained group improves because of upsells and post-campaign add-ons. That's not a contradiction. It's a sign that customer loyalty and revenue quality don't always move together.
If you're trying to raise lifetime value, a more detailed playbook helps. The CLV growth playbook for Amazon brands is a useful reference point for thinking about repeat monetization, even though crowdfunding has a different purchase pattern. For a related lens on costs, see customer acquisition cost in the PledgeBox library.
What to watch: a stable retention rate can still mask losing your highest-value backers while replacing them with lower-value ones.
That's why retention is really a family of metrics. The count tells you who stayed. The revenue view tells you what they were worth.
Retention only makes sense inside a time window. A month, a quarter, a year, or a campaign cycle can all be valid, but they answer different questions. Zendesk notes that teams can measure retention over a specific period, and that time-bounding is the point, not an afterthought.
Here's a simple way to choose.
| Business Model | Suggested Window | Why It Fits | What to Watch For |
|---|---|---|---|
| Subscription SaaS | Monthly or quarterly | Usage and renewals change quickly | Short windows can overreact to normal swings |
| Retail | Quarterly | Purchase cycles are less constant | A single month may miss repeat behavior |
| Crowdfunding | Campaign to campaign | Backer behavior follows launch cycles | Don't mix launch windows without a cohort plan |
A crowdfunding creator usually cares less about a calendar month and more about the last meaningful event. Did backers from the previous launch return for the next one? Did they finish the survey? Did they respond to shipping updates? Those are event-driven signs of retention, and they're closer to how the business runs.
A cohort is just a group you track over time. In practice, that means tagging backers by campaign, creator, or pledge cycle so you can compare like with like. If you blend different launch windows together, you can make one campaign look stronger just because it had more new demand.
Keep the window consistent. If you compare a campaign-to-campaign cohort with a quarter-to-quarter cohort, the math may be correct, but the conclusion won't be.
That's the main confusion for first-time creators. They think retention is one universal number. It isn't. The right window depends on how your customers behave.

Published benchmarks give you context, but they can also tempt you into bad comparisons. One 2026 roundup puts insurance at 84%, banking at 75%, retail at 63%, hospitality at 55%, and SaaS at 35%. Another benchmark shows e-commerce at 38% and media and professional services at 84%. Those spreads show that retention is shaped by industry structure, not just good or bad execution. The Salesforce benchmark roundup is the cleanest reference point for those industry differences.
The important lesson is that a crowdfunding creator shouldn't chase a SaaS target as if the businesses were the same. A subscription product has a recurring relationship baked in. A campaign has launch cycles, fulfillment phases, and often long gaps between meaningful interactions. The right question isn't whether you match a retail benchmark. It's whether the same backers show up again when your next campaign opens.
For crowdfunding, retention should connect to operational behavior, not a borrowed industry average. The signals that matter are more concrete.
That's more useful than forcing your business into a number that belongs to a different model. IBM also treats 100% retention as ideal, while making clear that actual retention varies by industry. That's a helpful ceiling to remember, not a realistic daily expectation. IBM's retention overview frames the standard well.
The benchmark for a creator is whether each campaign leaves you with a warmer audience than the last one. If your survey response gets cleaner, your upsells become more natural, and more backers reappear on the next launch, you're moving in the right direction.
Most creators look first at ads, traffic, or launch pages. The more practical lever is the post-campaign relationship, because that's where the next purchase usually starts. If the survey and pledge manager are clunky, you lose the chance to turn a buyer into a repeat backer.
PledgeBox handles the backer survey for free and only charges 3% on upsell sales if there's any. That fee structure matters because it removes the usual upfront hesitation around retention tools. You can use the survey to confirm shipping details, collect preferences, and surface add-ons without paying a base fee just to keep the relationship alive.
The easiest way to understand the difference is with a simple analogy. A Kickstarter pledge manager is like Amazon, the platform owns most of the buyer relationship. A PledgeBox pledge manager is like Shopify, the creator owns the storefront, the message, and the follow-up. That ownership changes what you can do next.
If you own the customer relationship, you can re-engage backers after the campaign, guide them through add-ons, and keep your own audience data in a place you can use. That's why post-campaign tooling isn't just an operations detail. It's a retention strategy.
For teams who want a fuller view of repeat value, this customer lifetime value guide gives a useful operational frame. The point isn't to chase more tools. It's to keep the relationship in a place where you can act on it.
Operational truth: the cheapest retention win is usually not a new ad campaign, it's a cleaner way to ask existing backers to stay involved.
Creators don't need enterprise software to do that. They need a survey that gets answered, an upsell flow that doesn't feel awkward, and a system that keeps the brand relationship in their hands.
Retention gets clearer once you track the same people across launches. Start by defining one cohort, usually backers from a specific campaign. Then tag them by campaign, export survey completion data, and compare that group to the next launch instead of mixing everyone together.
The useful data points are straightforward. Who completed the backer survey, who added extras, who shipped smoothly, and who never finished the process. PledgeBox surfaces that kind of information through downloadable reports, direct vendor exports, and backer-level shipment tracking, which means you can see behavior without stitching together a pile of spreadsheets.
A cleaner workflow beats a larger spreadsheet. If survey completion drops, you'll spot it early. If shipping confusion rises, you'll see it in the same place you review add-ons and address data. That makes retention a management habit, not a quarterly surprise.
The main mistake is waiting too long to look. If you review retention at the same cadence as fulfillment, you can fix the problem while the campaign memory is still fresh.
Start with the next campaign, not the last one. Send the backer survey for free, confirm shipping and preferences, and make the response process as short as possible. Then configure add-on upsells so retained backers have a natural way to increase their order without starting over.
After that, export the data and keep the cohort intact. You want the next launch to begin with a known group, not a cold list. That makes it easier to see who returned, who expanded, and who drifted away.
A healthy retention plan doesn't need a perfect number. A 100% retention rate is ideal, but real businesses usually work toward steady improvement instead of perfection. In crowdfunding, one cleaner campaign can teach you more than a borrowed benchmark ever will.
If you're building that kind of process, PledgeBox gives creators a way to send the backer survey, manage add-ons, track fulfillment data, and keep the post-campaign relationship in one place. Visit PledgeBox if you want a survey and pledge manager workflow that helps you measure retention while you run the next launch.
PledgeBox
The All-in-One Toolkit to Launch, Manage & Scale Your Kickstarter / Indiegogo Campaign