 PledgeBox
10 Marketing Analytics Metrics Creators Should Track
Learn the 10 marketing analytics metrics crowdfunding creators need, from CAC and ROAS to conversion rate and NPS, with benchmarks and tracking tips.

Learn the 10 marketing analytics metrics crowdfunding creators need, from CAC and ROAS to conversion rate and NPS, with benchmarks and tracking tips.
You have 40,000 page visits, ads spending every day, and a pledge total that still sits behind target. Traffic isn't the missing piece. You don't know which visitors became backers, what each backer cost you, or whether those backers will buy an add-on or support your next project.
That's because a crowdfunding journey crosses channels. A backer might see an ad, join your pre-launch list, return through email, pledge, and later add an upsell. Recent measurement research summarized by Digital Applied's marketing analytics statistics says 61% of marketers identify cross-channel measurement as their top analytics challenge. Platform reports alone won't untangle that path.
The right marketing analytics metrics follow the full lifecycle. You'll use acquisition and conversion numbers before launch and in the first 72 hours, ad efficiency numbers while you're live, and value and retention numbers after delivery. Track them by source, keep definitions steady, and review them on a schedule you will keep.
These ten metrics won't fix a weak offer. They will show you whether the problem is attention, persuasion, cost, or follow-through, so you spend your limited time on the lever that's broken.
Customer Acquisition Cost is your total acquisition spend divided by the number of new backers gained in the same period. Include ads, creator fees, promotional tools, and influencer payments. A blended CAC hides trouble, so calculate it by channel.

Say a board game publisher finds a niche tabletop newsletter brings backers far more cheaply than broad social ads. Money moves there. Say a hardware team tests three ad creatives and one costs more per backer than the pledge is worth. That creative dies, even if its clicks look strong.
PledgeBox is free to send the backer survey and only charges 3% of upsell revenue if there's any, so survey outreach to existing backers doesn't inflate CAC. Think of Kickstarter's pledge manager like Amazon, tied to its marketplace checkout. PledgeBox's pledge manager is like Shopify, a creator-branded store for what comes after.
Return on Ad Spend (ROAS) divides ad-attributed revenue by ad spend. A ROAS of 4 means four dollars in pledges for every dollar spent. Use it to judge whether paid promotion merits more budget during a live campaign, but account for attribution limits.
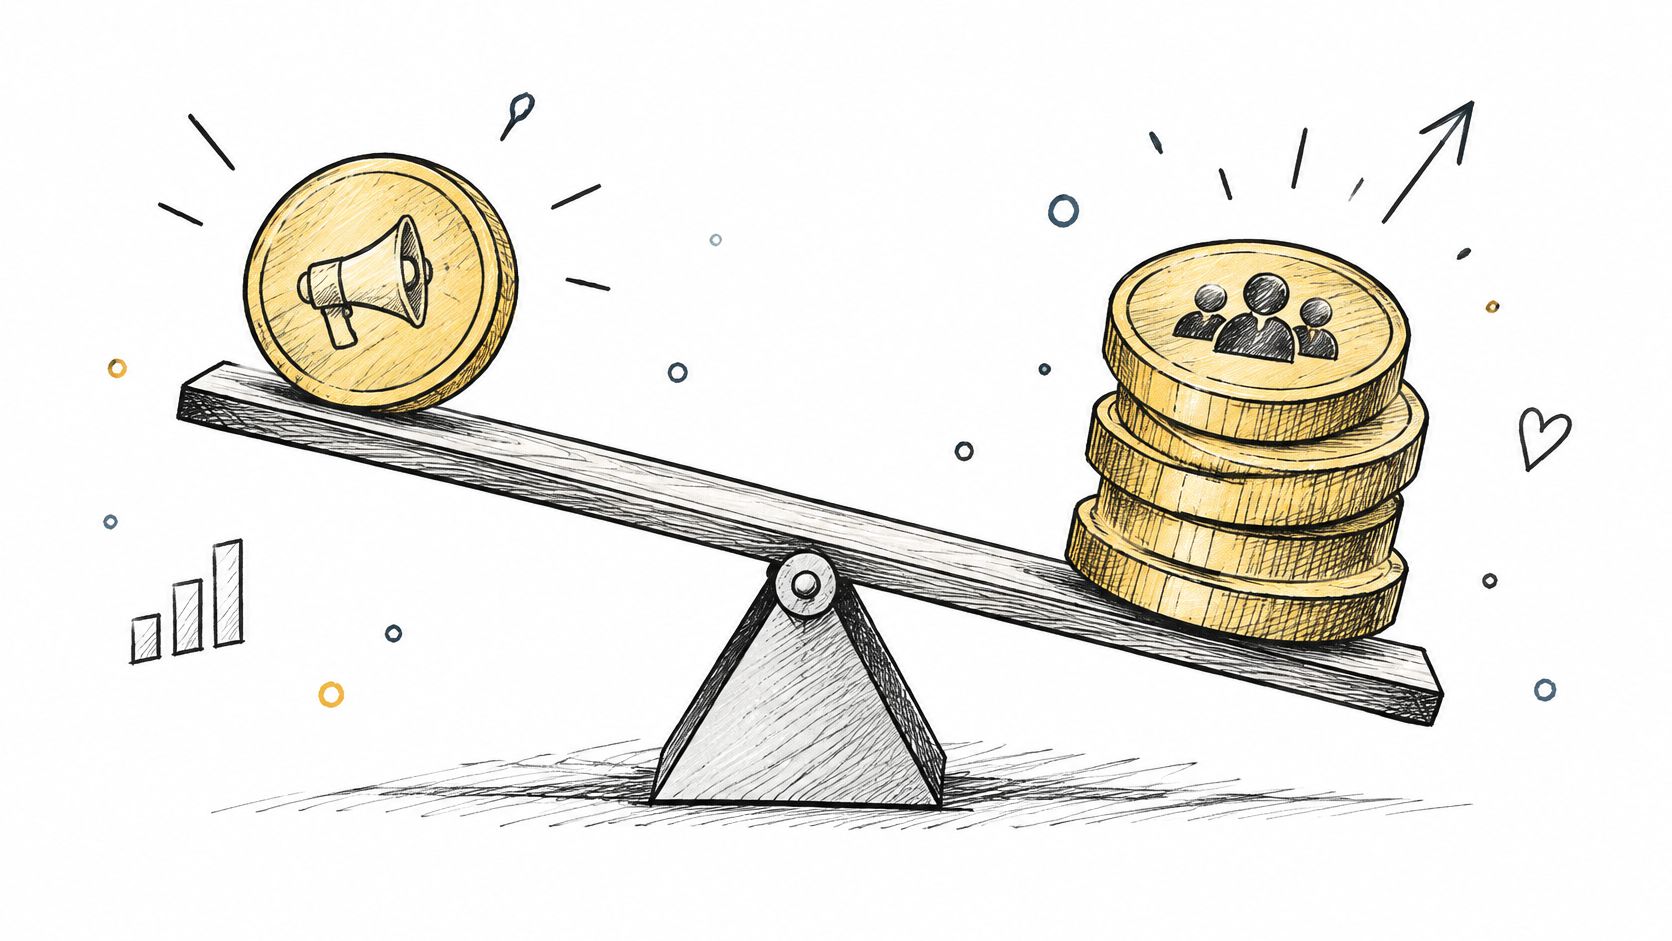
A tabletop publisher might pause a video ad that remains below break-even, while a gadget team shifts spend to retargeting ads that bring returning visitors back to pledge. In the first days of a campaign, check results daily so you can adjust while momentum is building.
Attributed ROAS can look lower when you exclude backers who would have pledged organically. That can still be the better measure: avoid paying for demand your ads did not create.
ROAS does not show whether revenue covers fees and fulfillment. Compare pledge value and expected add-on revenue with your break-even point after those costs. Track the calculation by ad channel and review it through the live campaign, then update it with post-campaign add-on results.
PledgeBox's Pledge Manager manages backer surveys and upsells. Surveys that collect shipping addresses and product choices without additional payment are free, while add-on sales during surveys incur a 3% fee. Account for that fee when estimating net post-campaign revenue, rather than treating gross add-on sales as profit.
Your page can be busy and still fail. Conversion rate is conversions divided by total visitors, multiplied by 100. In crowdfunding, that action changes by phase, pre-launch sign-up first, then a completed pledge.

Event based tracking helps you separate those actions instead of treating every visit as equal. Google Analytics 4 appeared in October 2020 and became the successor when Universal Analytics stopped processing new data on July 1, 2023, according to My Codeless Website's Google Analytics history. Define events for sign-ups, pledge starts, completed pledges, and survey completion.
Say a creator adds a reward comparison table and mobile conversion improves. Say a hardware team tests two project videos and keeps the one driving more pre-launch sign-ups. Segment every result by traffic source and device, because a strong overall rate can hide a broken mobile experience.
PledgeBox is free to send the backer survey, so use it to ask backers where they hesitated.
Click-through rate divides clicks by impressions and multiplies by 100. It measures whether a headline, image, or subject line earns attention. It doesn't measure whether that attention was worth buying.
Low CTR usually points to weak creative or poor targeting. High CTR with low conversion points somewhere else, to a mismatch between what the ad promised and what the project page delivers. Don't celebrate the click until you've checked what happened after it.
Say a board game creator tests three email subject lines and sends the winner to the full pre-launch list with a reward preview. Say a consumer electronics team finds short video ads earn far more clicks than static banners. In both cases, the useful routine is the same. Test one variable, record the result by audience, and pair CTR with conversion rate.
PledgeBox's newsletter and email tools make those touchpoints measurable, but the discipline is yours. Review CTR every few days while live.
Customer Lifetime Value estimates total revenue from one backer across the whole relationship. For creators, that includes the initial pledge, add-ons, late pre-orders, subscriptions, and repeat backing on later projects. It's the number that tells you what CAC you can afford.
A backer who looks expensive on day one may be your best buyer by month six. Say a board game publisher finds expansion buyers spend far more over time than base reward backers. Say a hardware team keeps selling late pre-orders after the campaign closes. Both patterns change how much acquisition spend is rational.
PledgeBox supports add-on upsells and late backer pre-orders that extend revenue past campaign close. PledgeBox is free to send the backer survey and only charges 3% of upsell revenue if there's any. That known cost makes CLV modeling cleaner than guessing at fees later.
Before launch, your list is your launch day. Email open rate is unique opens divided by delivered emails. It reflects subject lines, sender name, timing, and whether subscribers still want to hear from you.
Opens are an imperfect signal, since some mail apps load tracking pixels automatically. Treat open rate as a directional check on attention, then confirm with clicks and sign-ups. A list that opens but never clicks is entertained, not committed.
Say a tabletop creator sends a pre-launch preview and a personal, specific subject line outperforms a generic announcement. Say a product designer segments backers by reward tier and sends survey reminders only to people who haven't responded. Both moves respect attention instead of blasting everyone.
PledgeBox is free to send the backer survey, so you can measure open and response rates on survey invitations without adding survey fees. Track them from pre-launch through fulfillment updates.
Raising what each backer spends is often cheaper than finding new backers. Average Order Value divides total revenue by the number of orders. In crowdfunding, it includes the base pledge plus add-ons, and shipping or taxes where applicable.

Say a board game publisher bundles an expansion instead of adding confusing new tiers, and AOV climbs. Say a hardware creator offers a relevant accessory during the survey. The pattern is the same, existing trust does the selling. Our explainer on what is average order value covers the math in full.
PledgeBox is free to send the backer survey and only charges 3% of upsell revenue if there's any, so you can model net AOV with a clear fee.
Retention rate is the share of backers who buy or back again over a set period. Churn rate is the share who stop. For creators, retention is really a trust score, and it's earned mostly after the campaign ends.
Slow fulfillment and silent updates drive churn more reliably than any ad problem. Say a tabletop publisher notices backers who received tracked shipping updates return for the next project more often. Say a gadget team surveys backers after delivery and fixes a packaging flaw several people flagged. Communication is doing retention work in both cases.
Backers forgive delays they hear about early. They rarely forgive silence.
PledgeBox's mobile friendly backer portal, automated reminders, and notifications keep backers informed without manual chasing. PledgeBox is also free to send the backer survey, so asking why people stayed or left costs you time, not fees.
Net Promoter Score asks how likely someone is to recommend your project, on a scale of 0 to 10. Scores of 9 or 10 are promoters, 7 or 8 are passives, and 0 to 6 are detractors. NPS is the percentage of promoters minus the percentage of detractors.
Timing matters more than volume. Ask right after pledging and you're measuring excitement about a promise. Ask after delivery and you're measuring the product, packaging, and communication together. Only the second score predicts whether backers will share your next launch.
Say a board game creator's detractors all mention late packaging updates, which prompts a new fulfillment checklist. Say a hardware team invites promoters to review an early prototype for its next campaign. The score starts the conversation, the comments tell you what to fix.
PledgeBox is free to send the backer survey, so you can collect NPS alongside address and reward details without extra cost.
Follower counts flatter you. Engagement rate divides total interactions by reach or impressions, multiplied by 100. Comments, shares, saves, replies, video views, and survey responses all count, and they show whether people care enough to participate.
Say a tabletop creator finds behind the scenes prototype videos draw far more comments than rulebook teasers, and rebuilds the pre-launch calendar around prototypes. Say a product team treats survey responses as engagement and discovers which feature backers mention unprompted. For more on reading these signals, see engagement tracking for content creators.
High engagement before launch often predicts stronger early momentum, but only if those people are on your list. PledgeBox's audience capture and survey tools turn passive followers into identifiable respondents. Review engagement weekly during pre-launch and daily once you're live.
| Metric | Formula | Best For | Review Frequency |
|---|---|---|---|
| Customer Acquisition Cost (CAC) | Total acquisition spend ÷ new customers acquired | Comparing acquisition costs by channel and setting ad budgets | Daily during the first 72 hours |
| Return on Ad Spend (ROAS) | Ad-attributed revenue ÷ ad spend | Assessing ad profitability and shifting campaign budgets | At least every 24 hours during the first week |
| Conversion Rate | Conversions ÷ total visitors × 100 | Evaluating project page, rewards, and checkout performance | By funnel stage and traffic source |
| Click-Through Rate (CTR) | Clicks ÷ impressions × 100 | Measuring how well ads, emails, and posts attract clicks | In real time, by creative and audience |
| Customer Lifetime Value (CLV) | Estimated revenue per customer across the relationship | Evaluating long-term backer value and acquisition spend | By campaign cohort and over time |
| Email Open Rate | Unique opens ÷ delivered emails × 100 | Assessing email subject lines, timing, and list engagement | After each send |
| Average Order Value (AOV) | Total revenue ÷ number of orders | Evaluating reward tiers, bundles, and add-on sales | By campaign, reward tier, and order updates |
| Retention and Churn Rate | Retention: customers remaining ÷ starting customers × 100; churn: customers lost ÷ starting customers × 100 | Tracking repeat backing and ongoing customer loyalty | Monthly, quarterly, or per campaign |
| Net Promoter Score (NPS) | Promoter percentage − detractor percentage | Measuring backer loyalty and post-delivery satisfaction | After delivery and over time |
| Engagement Rate | Total interactions ÷ reach or impressions × 100 | Assessing audience interest and content performance | By content type and posting time |
A weekly review only helps if it matches the decisions in front of you. During the first week live, review CAC and ROAS daily. Check conversion rate and CTR by traffic source every few days to spot ad fatigue or project-page problems. After delivery, review AOV, CLV, retention, and NPS to guide the next launch and follow-up.
Disconnected tools can distort campaign results. The 2025 State of Your Stack Survey reports that 65.7% of organizations identify data integration as one of their biggest stack management challenges. Use a consistent campaign and backer identifier across pre-launch, the live campaign, surveys, and upsells. Otherwise, duplicate identities can undermine return calculations.
Confidence in measurement does not guarantee complete coverage. Nielsen reported that in 2025, 85% of marketers were confident in their ability to measure ROI, while only 32% reported measuring ROI across traditional and digital media, according to Nielsen's marketing ROI blueprint announcement. Creators face a similar gap: ad reports may be clear while post-campaign results remain hard to connect.
Track incremental revenue per captured lead, not just attributed ROAS. Where possible, compare exposed and unexposed groups. You can also test a reminder email against a small holdout. Keep original pledges separate from shipping recovery, add-ons, and pre-orders.
Account for post-campaign costs when reviewing revenue. PledgeBox surveys that collect shipping addresses and product choices without additional payment are free. Pledge Manager manages backer surveys, upsells, shipping fees, and tax/VAT collection. Keep survey revenue distinct from the original campaign pledge when comparing results.
Choose three metrics for your weekly review. Before launch, start with CAC, conversion rate, and AOV. After a previous campaign has delivered, ROAS, CTR, and retention can help focus your next decisions. Set a target for each and record the exact definition you use. Review them on the same day each week. A metric without a target or a regular review rarely guides a decision.
Set up measurement from pre-launch sign-ups through post-campaign surveys and add-ons. PledgeBox provides separate workspaces for pre-launch, live campaigns, and email marketing. Visit PledgeBox to explore campaign measurement and backer surveys.
PledgeBox
The All-in-One Toolkit to Launch, Manage & Scale Your Kickstarter / Indiegogo Campaign