 PledgeBox
Campaign Analytics Dashboard: How to Read Your KPIs
Use a campaign analytics dashboard to track pledge velocity, traffic sources and repeat backers, then turn each KPI into a clear campaign fix.

Use a campaign analytics dashboard to track pledge velocity, traffic sources and repeat backers, then turn each KPI into a clear campaign fix.
In 2025, only 1 in 10 marketers reported having access to real-time brand data, and 34% said they tracked return on investment consistently, according to Adobe's survey of 412 U.S. marketing professionals. Crowdfunding squeezes that problem into 30 days. A campaign produces its most useful signals in the first 72 hours and its most expensive ones in the last 48. A dashboard that reports both a week late is a history lesson.
Most creators read a campaign analytics dashboard as a scoreboard. The better use is as a phase detector. A falling average pledge in week three usually means the early-bird tiers sold out, which is healthy. A rising traffic line with flat pledges means the traffic is wrong, which isn't. Same numbers, opposite readings, decided entirely by where you sit in the campaign.
Eight panels cover what a live campaign needs to know. Everything else is decoration.
| Metric | What It Tells You | Where to Check | Act When |
|---|---|---|---|
| Pledge velocity | Pledges per day, read against your first 48 hours and against comparable campaigns at the same stage | Pledge velocity panel | Daily pledges fall for three days running |
| Funding percentage | Progress toward the goal, useful only next to campaigns of similar size and category | Campaign page and dashboard summary | Pace falls behind comparable campaigns |
| Traffic by source | Which channels bring visitors, and in what share | Traffic sources panel | One channel supplies most visits |
| Landing-page conversion | Share of visitors who pledge | Live campaign analytics | Visits rise but conversion falls |
| Average pledge | Typical backing value | Pledge reports | Average drops as early-bird tiers sell out |
| Repeat-backer share | Backers who pledged before, to you or another creator | Backer reports | Share falls in the middle phase |
| Referral share | Pledges that arrive from backers sharing the campaign | Referral program reports | Referrals stay flat after launch |
| Newsletter-attributed pledges | Pledges from email to returning backers | Email reports | Update emails stop producing pledges |
Total pledges is the weakest number on that list. It moves in one direction and explains nothing about where the money came from.
Kickstarter recorded 35,512 projects launched in 2024, and successfully funded projects received $706 million in pledges, according to Kickstarter's 2024 Creative Download report. Against that much competition, the campaign that wins is rarely the one with the biggest day-one total. It's the one that knows which channel produced it and which message converted it.
Say a campaign clears its goal in nine days on the back of one newsletter mention and three pledges above $1,000. Funding percentage reads 100%, the creator stops watching traffic, and nobody notices that conversion from visits has halved. The board is green and the campaign is fragile. One channel is carrying it, and a handful of large pledges are masking a weak middle.
Velocity and source mix catch that. They also tell you when a number is behaving exactly as it should, which keeps you from "fixing" a campaign that isn't broken.
Take average pledge. It drops in the second half of most campaigns because early-bird tiers sell out and late backers buy standard rewards. That's a healthy drop. A drop while standard tiers are still open means people are choosing the cheapest way in, and the fix is the offer, not the ads. Our breakdown of the metrics to evaluate for a crowdfunding campaign covers the rest of the set if you want to weigh these eight against a longer list.
First-week rule: pick three panels, write down their day-one values, and treat those numbers as the baseline every later reading is compared against.
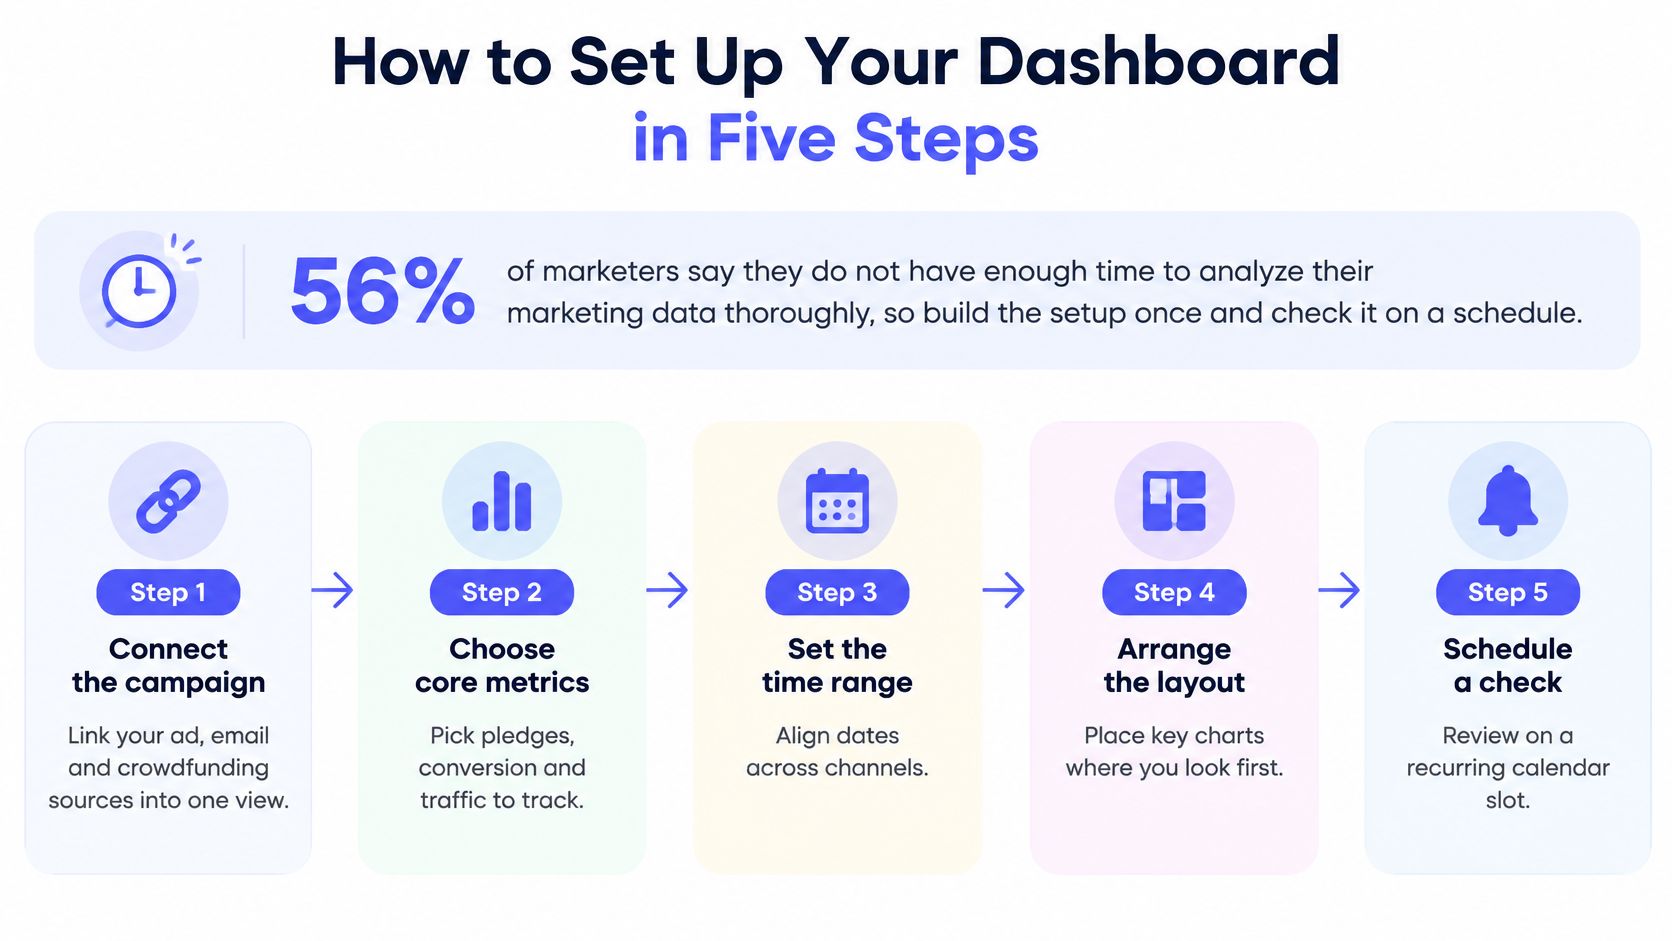
56% of marketers said they didn't have enough time to analyze their marketing data thoroughly, according to Supermetrics' survey of more than 200 marketers. That's an argument for building the setup once and checking it on a schedule, so the time goes into decisions instead of assembly.
Connect the campaign. Sign in to your PledgeBox Creator account, enter the campaign URL and confirm you have permission to manage that campaign. Without it, traffic and pledge data never load and every panel stays empty. The usual slip is connecting a campaign you only co-manage, then blaming the sync.
Tag every outbound link. Put UTM source parameters on ads, emails, partner posts and influencer links, and connect the ad and email accounts that send visitors. Untagged links collapse into direct traffic, which makes every channel look weaker than it is and leaves pre-launch traffic impossible to compare with live traffic.
Build one view per phase. Launch, middle and final push, each capped at eight panels from the table above. A launch view watches velocity and source mix, a middle view watches returning backers and comment activity, a final view watches urgency and sell-through. One 20-panel board gets opened twice and abandoned.
Add three conversion events. Landing-page visit, checkout start, completed pledge. Two events tell you where people leave, three tell you whether fewer people arrived or the same people hesitated. Tracking only completed pledges erases that difference.
Set a review rhythm before launch day. Daily checks for the first 72 hours, every two or three days in the middle, twice a day for the last 48 hours. Rhythm beats tooling. A plain board checked on schedule outperforms a complex one checked when someone remembers.
The five steps in sequence, with the panel each one feeds:
The source shares add up to total traffic, with no unexplained remainder. Velocity updates the same day pledges arrive, not the morning after. A channel you can't tag shows as unknown rather than defaulting to direct. If two panels disagree about the same day, fix the tagging before you trust either one.
Pledges can drop from sixty a day in launch week to four on day 12 of a 30-day campaign without signaling failure. Crowdfunding often follows an S-shaped funding curve: contributions cluster near launch and the deadline, with a quieter middle. Read each KPI against the campaign phase, not as a standalone score.
| Phase | Primary KPI | Warning Sign | Likely Response |
|---|---|---|---|
| Launch | First-48-hour velocity and pledges from prior backers | Traffic from one channel only, or no pledges from people who backed you before | Check traffic sources and send the launch update to prior backers |
| Middle | Repeat-backer share and returning-visitor conversion | Flat daily pledges alongside falling traffic or conversion | Post an update, reply to comments, and check whether new visits are arriving |
| Final push | Urgency-driven pledges and early-bird sell-through | No rise in pledges or tier sales as the deadline approaches | Remind new leads and returning backers about available limited tiers |
At launch, compare velocity with your own first 48 hours. A slower day after an opening surge is expected; a weak start paired with little traffic from prior backers calls for an immediate check of your audience and channel mix.
Product-reward campaigns may rely more heavily on early momentum, while campaigns without product rewards can depend on sustained engagement. A hardware campaign that goes quiet in week two deserves scrutiny, especially if visits or conversion are also falling. A cause or service campaign may hold a modest, steady pace and still finish strongly.
Updates and comments also need phase context. An update can prompt action when backers are engaged; sending another to an audience that has stopped responding may add noise without changing pledging behavior.
A dip is normal when conversion on visits holds. Act when traffic and conversion fall together, because the source and the message may both need attention.
Before reacting to one bad day, compare the same phase across campaigns of similar size. A flat middle is less concerning when traffic and conversion remain steady. A launch spike, however, is a poor forecast for the remaining weeks: projecting it forward can overstate the finish and conceal a shortfall until the deadline is close.
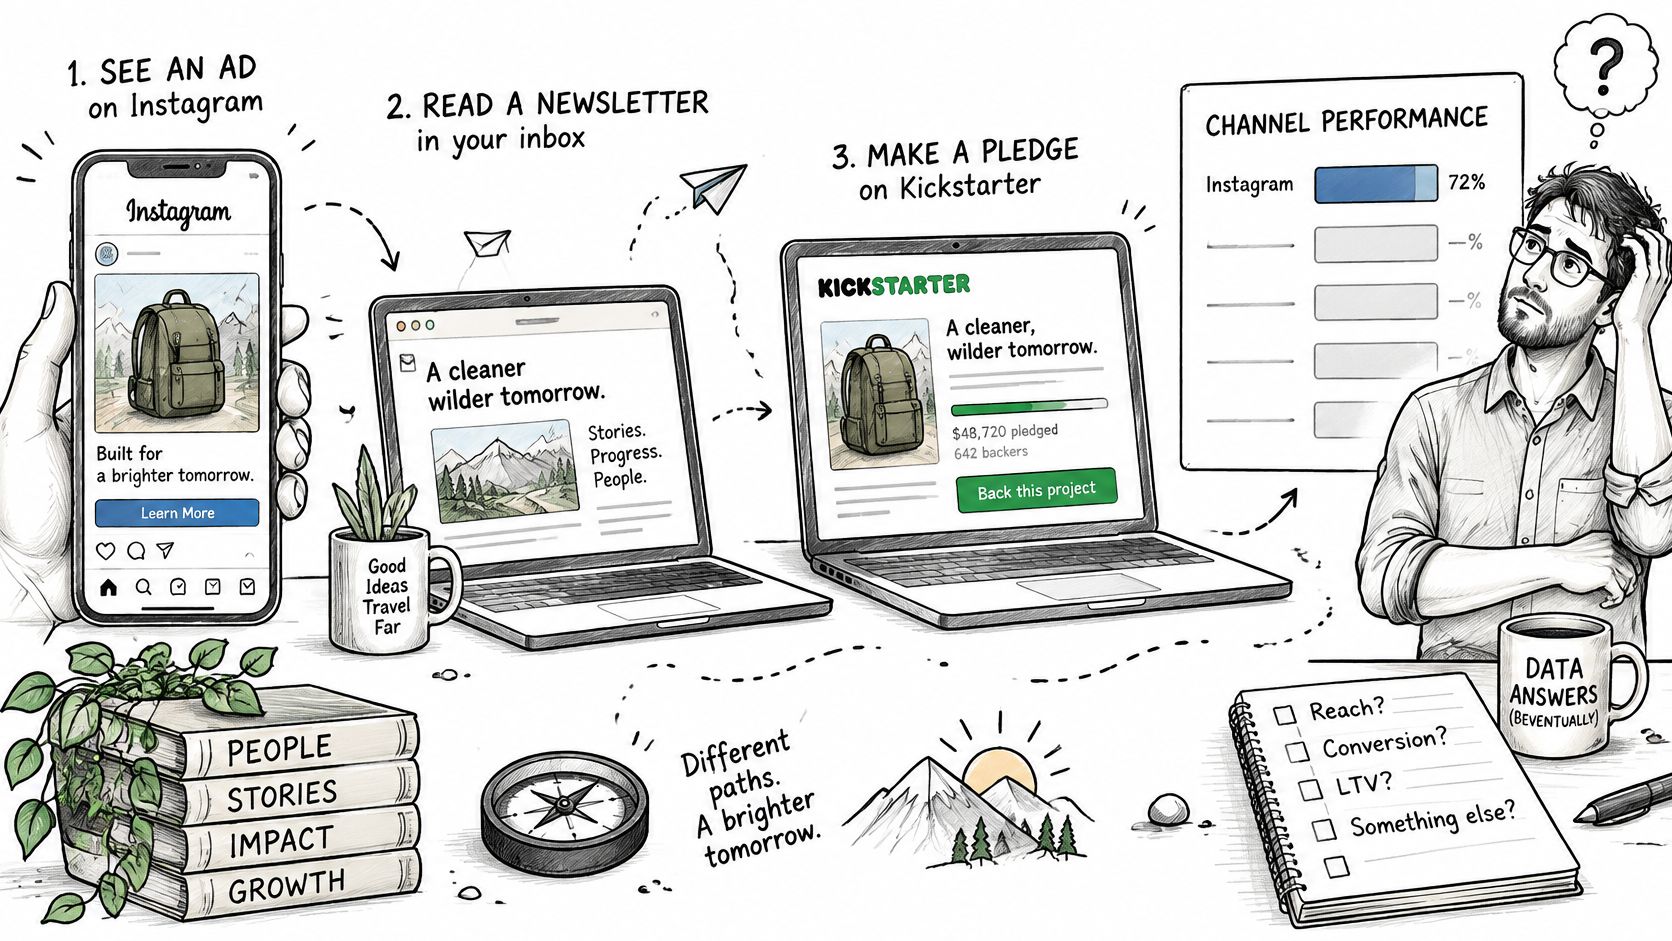
A backer sees your project in an Instagram ad on Tuesday, ignores it, opens your newsletter on Thursday and pledges on Kickstarter on Friday. Your dashboard credits Kickstarter, or email, or nothing at all. The ad that started the chain looks like wasted money.
A multi-step path like this is what a last-click report reduces to a single line:
Browser privacy controls, consent choices and platform restrictions on identifiers break that chain in ways no extra tracking tag repairs. Measurement has moved toward first-party events, server-side records and documented identity joins, and only 32% of marketers globally said they measured media spending across digital and traditional channels, according to Nielsen's 2025 annual marketing report. Familiarity isn't the bottleneck. More than 70% of surveyed European organizations reported high familiarity with privacy-first measurement, yet 53% still identified attribution without cookies as a barrier and 58% cited a lack of standardization, as Sumboard's dashboard guide reports.
Practical rule: before you trust a return-on-ad-spend figure, ask how many of the conversions behind it were observed rather than modeled.
The walkthrough below shows what the same path looks like when the events are wired properly:
Your dashboard should separate observed conversions from modeled or inferred ones, show consent coverage behind each metric, and report confidence or completeness. Adding more attribution models doesn't fix incomplete identity data. It creates false precision on top of it, and complex multi-touch charts are the easiest way to feel certain about a number that's half missing.
| Situation | Trust the Channel Ranking? | Use Instead |
|---|---|---|
| Observed conversions cover most of your tracked pledges, and one channel leads on several metrics | Yes, with a completeness check | Shift budget and recheck after one review cycle |
| Rankings change between views, or the gap between channels is small | No | Pause one source for three days or split the audience |
| Platforms can't share data at source level | Only partly | Blended source-level reporting |
If the referral panel is the one producing numbers you can't reconcile, this guide to understanding Kickstarter's referral metrics is the right starting point.
Only 39.2% of brand marketers said they measured whether their marketing work delivered business outcomes, according to Marketing Week, Kantar and Google's survey of more than 1,000 brand marketers. A test is how you join that group, because it ties a specific change to a specific result instead of a general feeling that things improved.
Pick one signal that's off. A drop in returning-visitor conversion, flat pledges in the middle phase, referrals that stalled after launch. One signal, not three.
Write the hypothesis in if-then form. If we change X, Y will move by about Z, because of the reason you suspect. Writing it down before you run it is what stops you from claiming afterwards that you knew all along.
Change one variable. The reward-tier headline, the first frame of the campaign video, the early-bird limit, the newsletter subject line. Two changes at once and you learn nothing about either.
Split the audience where you can. Send the variant to half your returning backers through your email tool and keep the other half as a control. Returning backers are the easiest group to split because you already have their addresses.
Run it across one full review cycle. A day's worth of data in a campaign that shifts daily is noise. A week captures the phase effect you're testing.
Decide, then log it. Keep, revert or retest, and write the result next to the panel it was meant to move, so the next person reading the board inherits the knowledge.
Here's the example that shows why the split matters. A creator sees velocity fall after day three and tests a limited early-bird reminder against a plain update post. The reminder lifts conversion among new visitors but does nothing for returning backers, who already own the early-bird tier. The creator sends reminders only to new leads and stops spending sends on people who had already decided.
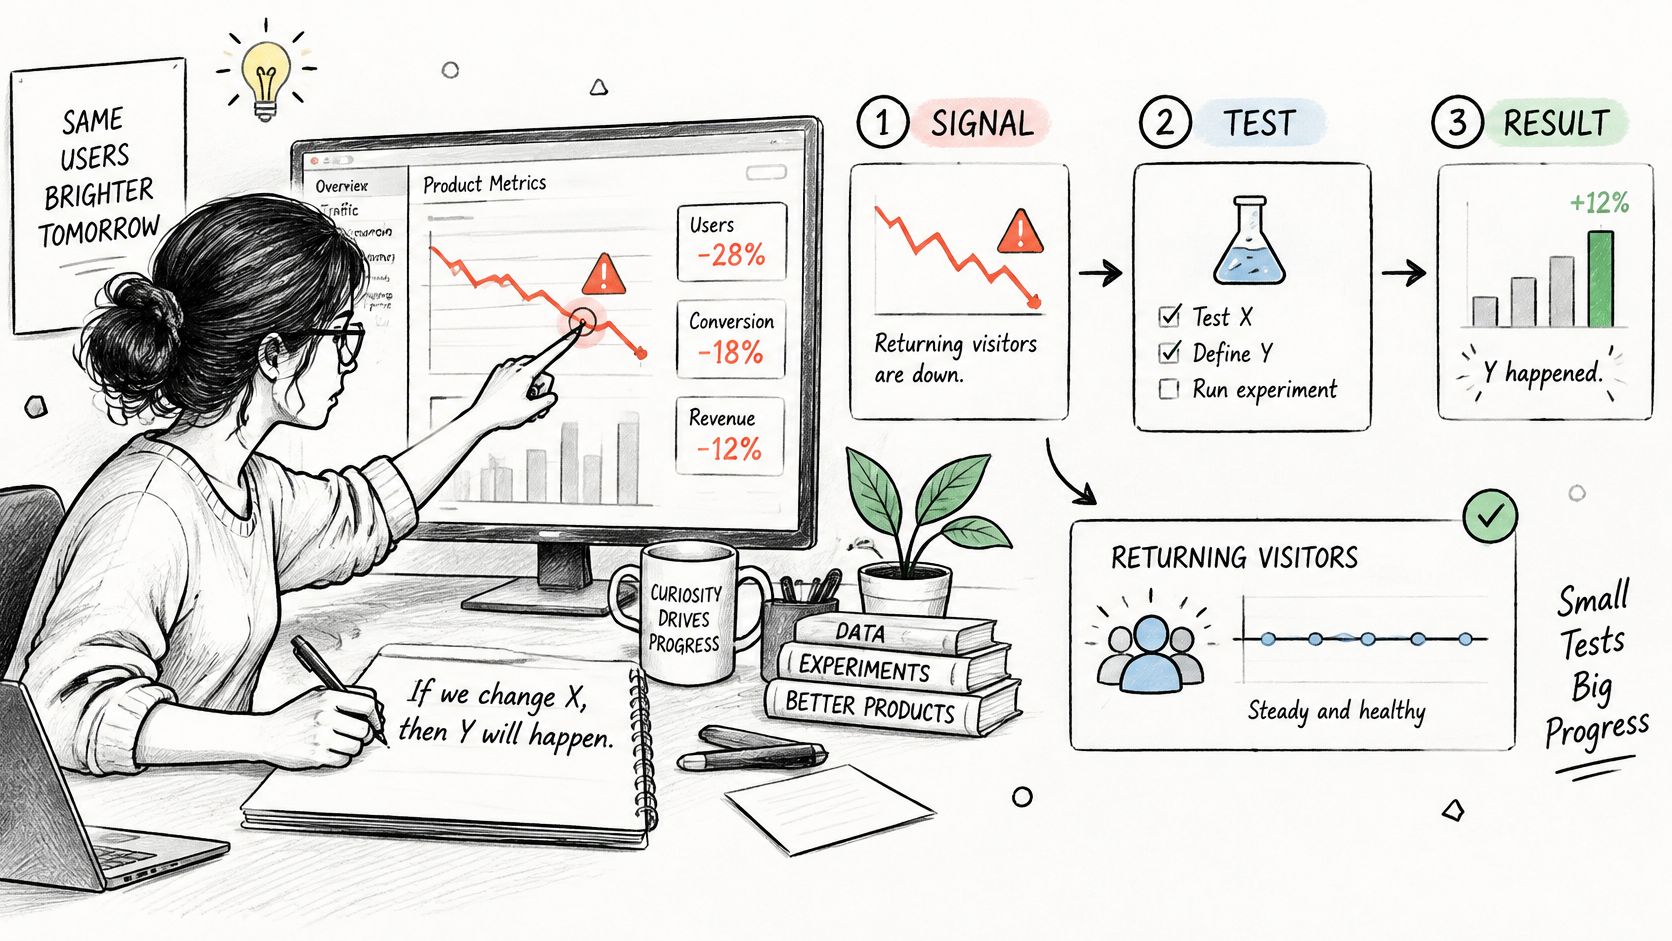
The three ways this goes wrong are predictable. Changing two things at once and crediting the wrong one. Reading a single-day spike as a result. Testing while the rest of the campaign is also changing, so the result belongs to the deadline rather than the variant.
After a campaign closes, survey completion and add-on sales are still worth tracking. A falling survey completion rate early in the invitation period can be normal; if it stalls while backers still have unresolved product or shipping choices, check the invitation and reminder flow. Upsell take-up can also flatten once interested backers have placed their orders. Compare it with the number of backers who have completed their survey, not just the campaign total.
PledgeBox's Pledge Manager handles backer surveys, upsells, shipping fees, and tax or VAT collection. It also supports custom survey domains, reward upgrades, and add-on products. PledgeBox charges no upfront, per-backer, or campaign fees. Its only platform fee is 3% on add-on sales collected during a backer survey, so a $100 add-on sale produces a $3 fee before payment-provider charges.
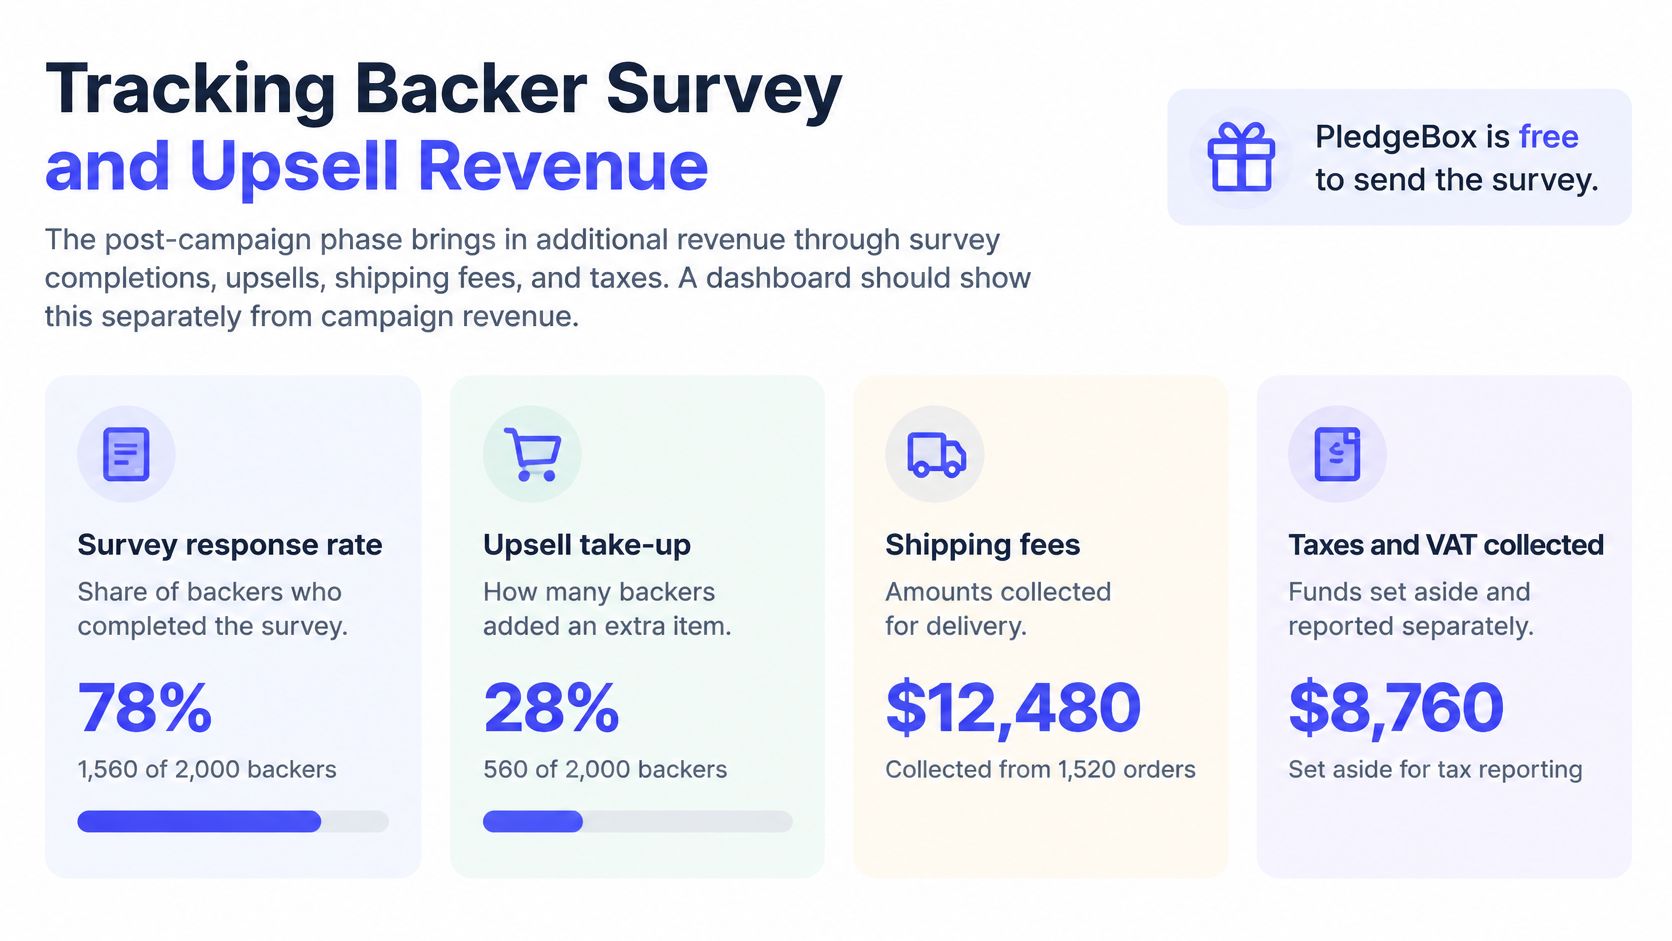
Track three measures: survey completion rate, add-on take-up per 100 backers, and revenue per backer after fees. Completion rate helps identify whether backers are finishing the survey; add-on take-up shows how many are choosing an extra product. Revenue per backer helps compare the return from add-ons after the platform fee, rather than treating every dollar collected as revenue retained.
Set the comparison point by campaign phase. A flat completion rate just after invitations go out may mean backers have not acted yet; a flat rate after reminders have run calls for a closer look at the survey flow. Likewise, a drop in add-on take-up as the remaining backers complete their surveys does not automatically mean the offer is failing. Review take-up alongside survey completions and net revenue to decide whether to adjust the offer or leave it alone. For the setup sequence, see this guide to backer surveys.
Give the first review a fixed order: check setup, confirm attribution, then choose one test.
Campaign Manager shows campaign rank, traffic sources, pledge velocity, and backer trends on one dashboard. Start with the measures tied to your current phase. A flat pledge velocity after a campaign's initial surge may be normal; a sustained decline alongside weaker backer trends gives you a reason to examine traffic and rewards.
Ask at every check-in: What changed, what might explain it, and what action will you take? If the next action is unclear, narrow the review to one metric and one test.
A scheduled review turns a 30-day campaign into a series of decisions. Start with three panels, one baseline, and one test. Add more only when they help you choose an action.
PledgeBox is a campaign management tool with a Campaign Manager for tracking campaign performance and a Pledge Manager for backer surveys. Sending the backer survey carries no per-backer fee, and PledgeBox charges 3% only on add-on sales collected during surveys. Explore PledgeBox to connect your campaign and begin reviewing its numbers by phase.
PledgeBox
The All-in-One Toolkit to Launch, Manage & Scale Your Kickstarter / Indiegogo Campaign